🔮 Day 2 - Spell Solutions#
Spell 1: Basic Loop Magic#
Challenge 1: Print your name 3 times#
# set the locale to English and UTF-8 encoding so that emojis can be displayed correctly
Sys.setlocale("LC_CTYPE", "en_US.UTF-8")
for (i in 1:3) {
  print("My name is Sky")
}
[1] "My name is Sky"
[1] "My name is Sky"
[1] "My name is Sky"
Challenge 2: Create a countdown from 10 to 1#
for (countdown in 10:1) {
  print(paste("Countdown:", countdown))
}
print("🚀 Blast off!")
[1] "Countdown: 10"
[1] "Countdown: 9"
[1] "Countdown: 8"
[1] "Countdown: 7"
[1] "Countdown: 6"
[1] "Countdown: 5"
[1] "Countdown: 4"
[1] "Countdown: 3"
[1] "Countdown: 2"
[1] "Countdown: 1"
[1] "🚀 Blast off!"
✨ Advanced Challenge#
animals <- c("🐶 dog", "🐱 cat", "🐰 rabbit", "🐸 frog", "🦆 duck", "🦉 owl")

for (i in 1:5) {
  print(paste("Animal", i, "is a", animals[i]))
}
[1] "Animal 1 is a 🐶 dog"
[1] "Animal 2 is a 🐱 cat"
[1] "Animal 3 is a 🐰 rabbit"
[1] "Animal 4 is a 🐸 frog"
[1] "Animal 5 is a 🦆 duck"
Spell 2: Loop Detective Challenge#
Broken Spell #1: Missing loop variable#
for (i in 1:7) {
  print(paste("Number:", i))
}
[1] "Number: 1"
[1] "Number: 2"
[1] "Number: 3"
[1] "Number: 4"
[1] "Number: 5"
[1] "Number: 6"
[1] "Number: 7"
Broken Spell #2: Missing closing brace#
for (spell in 1:4) {
  print("Magic spell")
}
[1] "Magic spell"
[1] "Magic spell"
[1] "Magic spell"
[1] "Magic spell"
Broken Spell #3: Wrong range#
for (num in 1:10) {
  print(paste("Counting:", num))
}
[1] "Counting: 1"
[1] "Counting: 2"
[1] "Counting: 3"
[1] "Counting: 4"
[1] "Counting: 5"
[1] "Counting: 6"
[1] "Counting: 7"
[1] "Counting: 8"
[1] "Counting: 9"
[1] "Counting: 10"
Broken Spell #4: Missing quotes#
students <- c("Alex", "Sam", "Jordan", "Taylor")
for (student in students) {
  print(paste("Hello", student))
}
[1] "Hello Alex"
[1] "Hello Sam"
[1] "Hello Jordan"
[1] "Hello Taylor"
Broken Spell #5: Incomplete calculation#
for (number in 1:5) {
  square <- number * number
  print(paste(number, "squared is", square))
}
[1] "1 squared is 1"
[1] "2 squared is 4"
[1] "3 squared is 9"
[1] "4 squared is 16"
[1] "5 squared is 25"
Advanced Detective Challenge:#
for (i in 1:4) {
  stars <- ""
  for (j in 1:i) {
    stars <- paste(stars, "⭐", sep="")
  }
  print(stars)
}
[1] "⭐"
[1] "⭐⭐"
[1] "⭐⭐⭐"
[1] "⭐⭐⭐⭐"
Spell 3: Art with Loops#
Example art creation#
# Create an otter swimming in the ocean scene
print("🌊 Otter Swimming in the Ocean 🌊")

# More ocean waves
ocean_waves <- "🌊🌊🌊🌊🌊🌊🌊🌊🌊🌊🌊"
otter_swimming <- "🌊🌊🌊🦦🌊🌊🌊🌊🌊🌊"
fish_swimming <- "🌊🌊🌊🐟🌊🌊🌊🌊🌊🌊"
sea_life <- "🐠🐟🦀🐚🌊🐡🦞🐙🐠🐟"
ocean_floor <- "🌊🪸🌊🦈🐠🌊🐟🌊🦀🪸🌊"


for (i in 1:15) {
  if (i < 3) {
    print(ocean_waves)
  } else if (i < 6) {
    print(otter_swimming)
  } else if (i < 9) {
    print(fish_swimming)
  } else if (i < 13) {
    print(sea_life)
  } else {
    print(ocean_floor)
  }
}
[1] "🌊 Otter Swimming in the Ocean 🌊"
[1] "🌊🌊🌊🌊🌊🌊🌊🌊🌊🌊🌊"
[1] "🌊🌊🌊🌊🌊🌊🌊🌊🌊🌊🌊"
[1] "🌊🌊🌊🦦🌊🌊🌊🌊🌊🌊"
[1] "🌊🌊🌊🦦🌊🌊🌊🌊🌊🌊"
[1] "🌊🌊🌊🦦🌊🌊🌊🌊🌊🌊"
[1] "🌊🌊🌊🐟🌊🌊🌊🌊🌊🌊"
[1] "🌊🌊🌊🐟🌊🌊🌊🌊🌊🌊"
[1] "🌊🌊🌊🐟🌊🌊🌊🌊🌊🌊"
[1] "🐠🐟🦀🐚🌊🐡🦞🐙🐠🐟"
[1] "🐠🐟🦀🐚🌊🐡🦞🐙🐠🐟"
[1] "🐠🐟🦀🐚🌊🐡🦞🐙🐠🐟"
[1] "🐠🐟🦀🐚🌊🐡🦞🐙🐠🐟"
[1] "🌊🪸🌊🦈🐠🌊🐟🌊🦀🪸🌊"
[1] "🌊🪸🌊🦈🐠🌊🐟🌊🦀🪸🌊"
[1] "🌊🪸🌊🦈🐠🌊🐟🌊🦀🪸🌊"
Spell 4: Story Scrambler Challenge#
Challenge 1: Reverse Word Order Spy Code#
Fill in the blanks:
original_story <- "In the Magic Forest, a smart rabbit and a tiny dragon became friends, built a flying boat out of leaves, and sailed through the sky to save a sleepy bear cub who was stuck on a candy cloud."

# First, let's split the story into individual words
# Note: unlist(strsplit()) is a magical spell that splits a string into a list of words
story_words <- unlist(strsplit(original_story, " "))
print("🔤 Original story words:")
print(story_words)
print(paste("📊 Total words:", length(story_words)))
[1] "🔤 Original story words:"
 [1] "In"       "the"      "Magic"    "Forest,"  "a"        "smart"
 [7] "rabbit"   "and"      "a"        "tiny"     "dragon"   "became"
[13] "friends," "built"    "a"        "flying"   "boat"     "out"
[19] "of"       "leaves,"  "and"      "sailed"   "through"  "the"
[25] "sky"      "to"       "save"     "a"        "sleepy"   "bear"
[31] "cub"      "who"      "was"      "stuck"    "on"       "a"
[37] "candy"    "cloud."
[1] "📊 Total words: 38"
# Step 1: Create reversed word list
reversed_words <- c()
for (i in length(story_words):1) {
  reversed_words <- c(reversed_words, story_words[i])
}

# Step 2: Print the reversed story
print("🔒 ENCODED (Backwards):")
reversed_story <- paste(reversed_words, collapse = " ")
print(reversed_story)  # Answer: reversed_story

# Step 3: Restore original order
original_words <- c()
for (i in length(reversed_words):1) {
  original_words <- c(original_words, reversed_words[i])  # Answer: i
}
print("\n🔓 DECODED (Original Order):")
original_restored <- paste(original_words, collapse = " ")
print(original_restored)  # Answer: original_restored
[1] "🔒 ENCODED (Backwards):"
[1] "cloud. candy a on stuck was who cub bear sleepy a save to sky the through sailed and leaves, of out boat flying a built friends, became dragon tiny a and rabbit smart a Forest, Magic the In"
[1] "\n🔓 DECODED (Original Order):"
[1] "In the Magic Forest, a smart rabbit and a tiny dragon became friends, built a flying boat out of leaves, and sailed through the sky to save a sleepy bear cub who was stuck on a candy cloud."
Challenge 2: Every-Other-Word Spy Code#
Fill in the blanks:
print("\n🚀 === CHALLENGE 2: EVERY-OTHER-WORD SPY CODE ===")

# Step 1: Create empty lists for odd and even positioned words
odd_words <- c()
even_words <- c()

# Step 2: Separate words by position
for (i in 1:length(story_words)) {
  if (i %% 2 == 1) {  # Odd positions
    odd_words <- c(odd_words, story_words[i])  # Answer: i
  } else {  # Even positions
    even_words <- c(even_words, story_words[i])  # Answer: i
  }
}

# Step 3: Create encoded message
encoded_words <- c(odd_words, "---", even_words)
print("🔒 ENCODED (Every-other-word):")
encoded_story <- paste(encoded_words, collapse = " ")
print(encoded_story)  # Answer: encoded_story

# Step 4: Decode back to original
decoded_words <- c()
for (i in 1:max(length(odd_words), length(even_words))) {
  if (i <= length(odd_words)) {
    decoded_words <- c(decoded_words, odd_words[i])  # Answer: i
  }
  if (i <= length(even_words)) {
    decoded_words <- c(decoded_words, even_words[i])  # Answer: i
  }
}

print("🔓 DECODED (Original Order):")
decoded_story <- paste(decoded_words, collapse = " ")
print(decoded_story)  # Answer: decoded_story
[1] "\n🚀 === CHALLENGE 2: EVERY-OTHER-WORD SPY CODE ==="
[1] "🔒 ENCODED (Every-other-word):"
[1] "In Magic a rabbit a dragon friends, a boat of and through sky save sleepy cub was on candy --- the Forest, smart and tiny became built flying out leaves, sailed the to a bear who stuck a cloud."
[1] "🔓 DECODED (Original Order):"
[1] "In the Magic Forest, a smart rabbit and a tiny dragon became friends, built a flying boat out of leaves, and sailed through the sky to save a sleepy bear cub who was stuck on a candy cloud."
Bonus: Secret Message Examples#
Example with mini secret:
my_secret <- "Meet me at the playground after school."
my_words <- unlist(strsplit(my_secret, " "))

# Method 1: Reverse encoding
reversed_secret <- c()
for (i in length(my_words):1) {
  reversed_secret <- c(reversed_secret, my_words[i])
}
print(paste(reversed_secret, collapse = " "))
[1] "school. after playground the at me Meet"
What is Open-Source Magic?#
Understanding Open-Source (No code needed - just discussion!)#
🧙♀️ What is Open-Source? Imagine a giant magical library where thousands of friendly wizards from all over the world share their best spells for FREE! Anyone can use them, improve them, and share them back to help other wizards.
Examples you know: YouTube, Google, free games - many of the tools you use every day are built with open-source magic!
Key Points Learned:#
📚 Open-source = free tools shared by friendly wizard-programmers
🤝 Wizard community helps each other solve problems
🎁 Always free to use and learn from
🌍 Getting better together when wizards improve spells
Spell 5: Getting Help with the Magic ? and ??#
Challenge 1: Explore the print function with ?#
?print
Challenge 2: Get help with paste#
?paste
Challenge 3: Try the super search with ??#
??plotting
??statistics
Challenge 4: Compare ? vs ??#
?plot         # Specific help for plot function
??plot        # All functions related to "plot"
Key Learning:
?= Get help for ONE specific function (like asking about a specific spell)??= Search for ALL functions related to a topic (like asking “show me all fire spells”)
Challenge: Pick 3 functions exploration#
# Example answers (students can pick any functions they've learned)

# Function 1: print
?print
# New thing learned: print() can take additional arguments like 'quote = FALSE' to remove quotes

# Function 2: paste
?paste
# New thing learned: paste() has a 'sep' argument to control what goes between words, and 'collapse' to join vectors

# Function 3: length
?length
# New thing learned: length() works on many different types of data, not just vectors
Spell 6: Your First Package - ggplot2#
Understanding the Big Picture (No code needed - just discussion!)#
Connection to Open-Source: Packages are the perfect example of open-source! It’s like a giant library where thousands of friendly wizards share their best spells for FREE! Anyone can use them, improve them, and share them back to help others. Someone created ggplot2 and shared it with the whole world for free!
What is Abstraction? This means “hiding the hard stuff so you can focus on the fun stuff!” Examples:
Riding a bike: You don’t need to understand how gears work, just pedal!
Using a microwave: You don’t need to know about radio waves, just press buttons!
Using ggplot2: You don’t need to know complicated math for drawing, just tell it what you want!
Challenge 1: Install and load ggplot2#
# Step 1: Install the package (like downloading an app)
# install.packages("ggplot2")

# Step 2: Load the package (like opening the app)
library(ggplot2)
Challenge 2: Check if it worked#
# Test if ggplot2 is loaded by running a simple command
ggplot()

Key Learning:
Packages are like apps that add new powers to R
install.packages()downloads them oncelibrary()opens them each time you want to use themPackages ARE open-source - shared freely by friendly programmers (wizards)!
Abstraction means packages hide the hard math so you can focus on creating amazing things!
Spell 7: Your First Plot (No Data Yet!)#
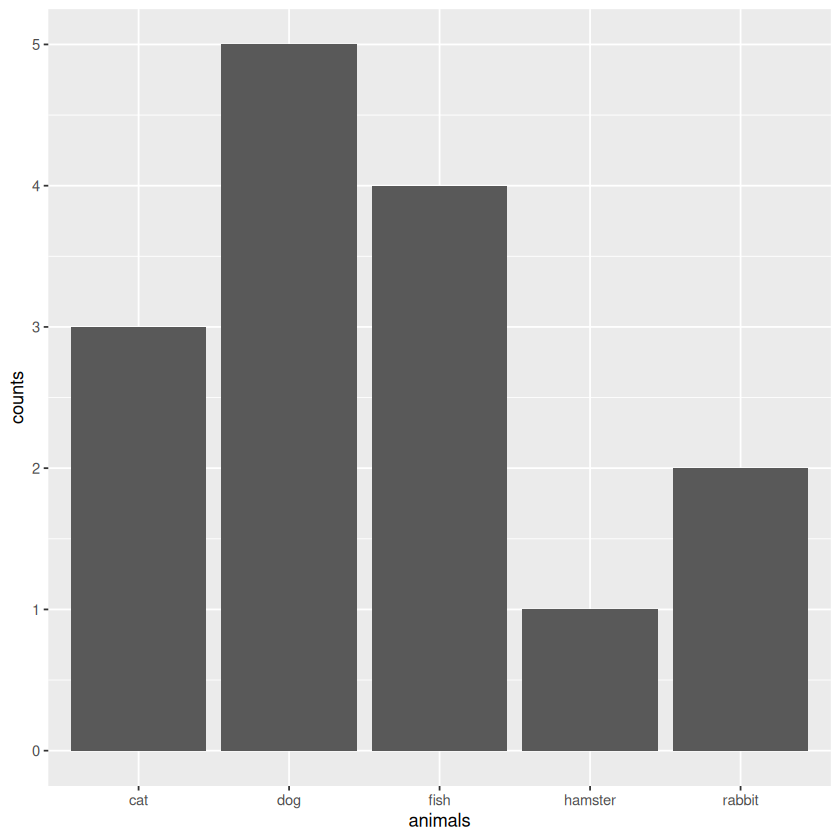
Challenge 1: Simple bar chart with lists#
library(ggplot2)

# Create simple lists
animals <- c("cat", "dog", "rabbit", "hamster", "fish")
counts <- c(3, 5, 2, 1, 4)

# Make your first plot!
ggplot() +
  geom_col(aes(x = animals, y = counts))
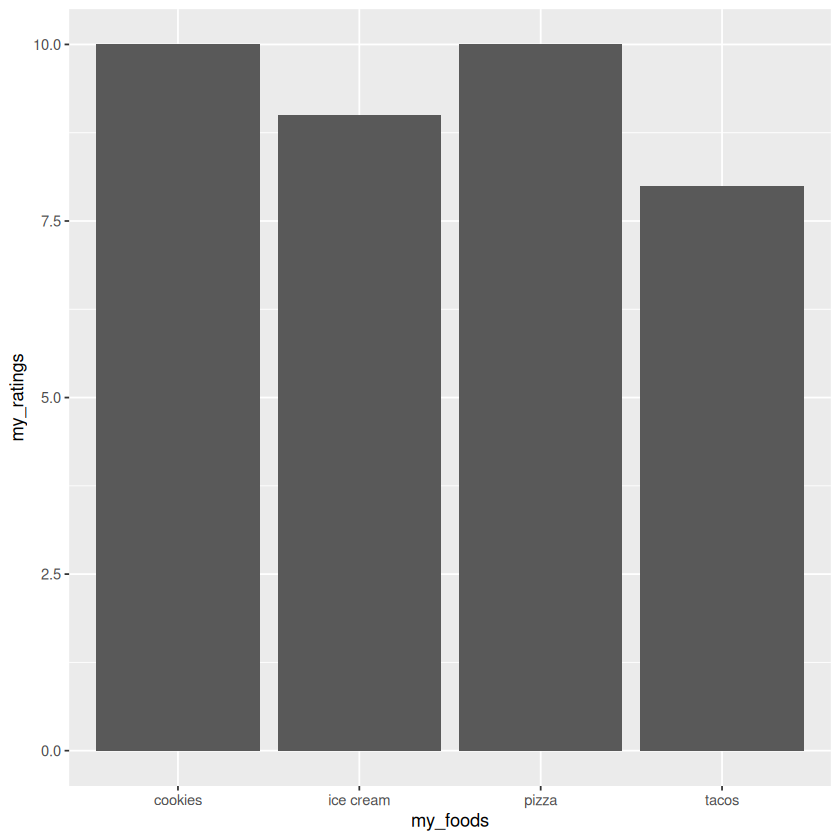
Challenge 2: Try your own data#
# Create your own lists
my_foods <- c("pizza", "ice cream", "tacos", "cookies")
my_ratings <- c(10, 9, 8, 10)

# Make a plot with your data
ggplot() +
  geom_col(aes(x = my_foods, y = my_ratings))
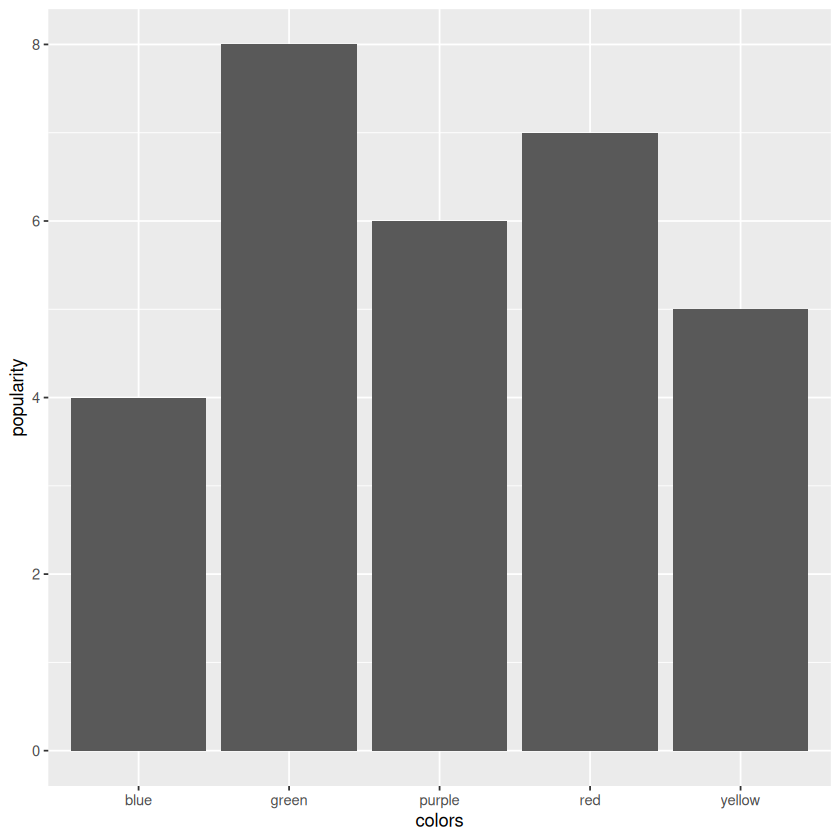
Challenge 3: Experiment with different data#
# Try with colors
colors <- c("red", "blue", "green", "yellow", "purple")
popularity <- c(7, 4, 8, 5, 6)

ggplot() +
  geom_col(aes(x = colors, y = popularity))
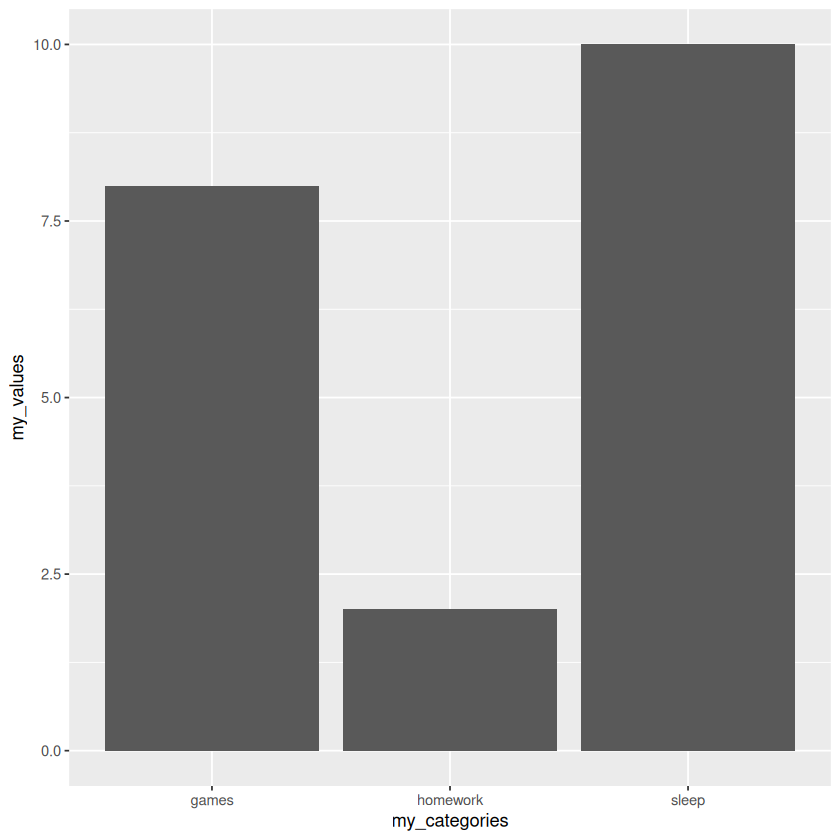
Challenge from Activity File: Create your own plot#
# Fill in your own data and create a plot
my_categories <- c("homework", "games", "sleep")  # Fill in 3 things you want to compare
my_values <- c(2, 8, 10)  # Fill in numbers for each thing

# Fill in the code below and run it
my_plot <- ggplot() +
   geom_col(aes(x = my_categories, y = my_values))
print(my_plot)
Key Learning:
c()creates simple lists (called vectors)ggplot()starts every plotgeom_col()makes bar chartsaes(x = , y = )tells R what goes on each axis
Spell 8: What is a Dataframe?#
Challenge 1: Create your first dataframe#
# Create a simple dataframe about pets
pets <- data.frame(
  name = c("Fluffy", "Buddy", "Whiskers"),
  type = c("cat", "dog", "cat"),
  age = c(3, 5, 2)
)

# Look at our dataframe
print(pets)
      name type age
1   Fluffy  cat   3
2    Buddy  dog   5
3 Whiskers  cat   2
Challenge 2: Create your own dataframe#
# Make a dataframe about your friends
friends <- data.frame(
  name = c("Alex", "Sam", "Jordan"),
  favorite_color = c("blue", "red", "green"),
  age = c(12, 11, 13)
)

print(friends)
    name favorite_color age
1   Alex           blue  12
2    Sam            red  11
3 Jordan          green  13
Challenge 3: Create a dataframe about anything!#
# Example: favorite movies
movies <- data.frame(
  title = c("Frozen", "Moana", "Encanto"),
  year = c(2013, 2016, 2021),
  rating = c(9, 10, 8)
)

print(movies)
    title year rating
1  Frozen 2013      9
2   Moana 2016     10
3 Encanto 2021      8
Key Learning:
Dataframes are like spreadsheets with rows and columns
Each column is a category (name, type, age)
Each row is one item (one pet, one friend, one movie)
data.frame()creates these magic tablesThink of them like organizing your Pokemon cards or book collection!
Spell 9: Visualizing Your Data Magic#
Challenge 1: Visualize your dataframe from Spell 8#
library(ggplot2)
# Example dataframe (replace with yours from Spell 8)
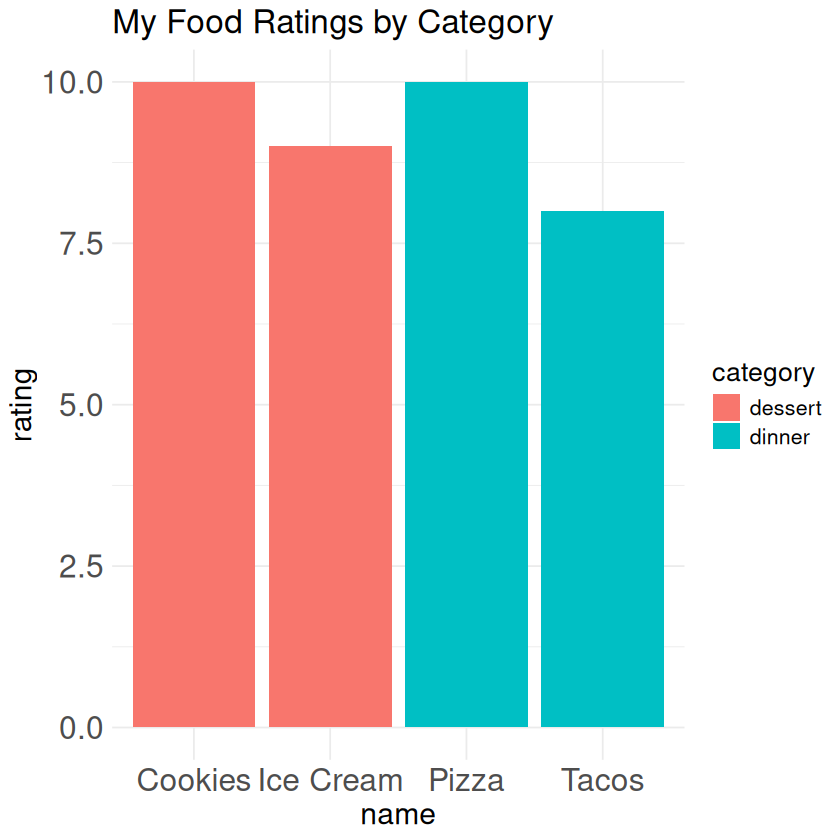
my_data <- data.frame(
name = c("Pizza", "Ice Cream", "Tacos", "Cookies"),
rating = c(10, 9, 8, 10),
category = c("dinner", "dessert", "dinner", "dessert")
)
# Create your first plot with YOUR data!
ggplot(my_data, aes(x = name, y = rating)) +
geom_col()

Challenge 2: Add some color magic!#
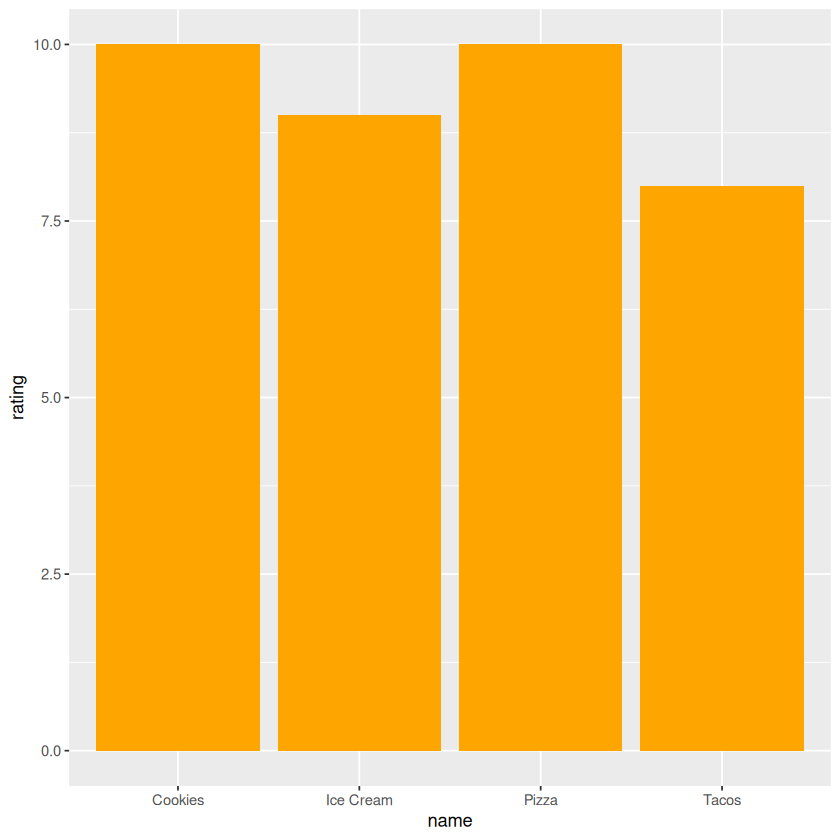
# Single color for all bars
ggplot(my_data, aes(x = name, y = rating)) +
geom_col(fill = "orange")
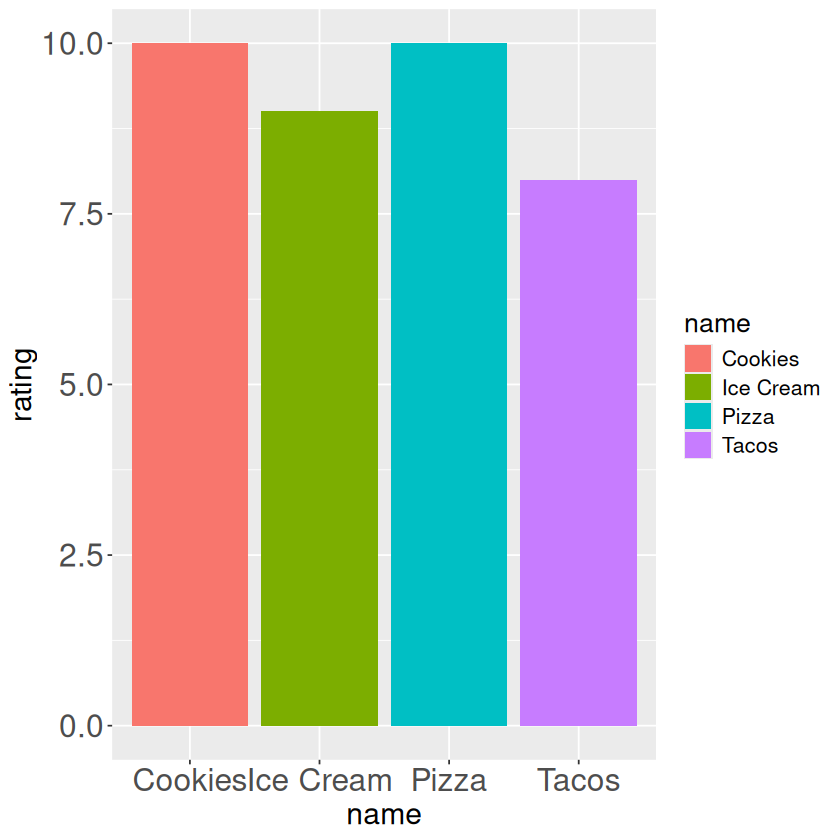
# Different color for each bar
ggplot(my_data, aes(x = name, y = rating, fill = name)) +
geom_col() +
theme(text = element_text(size = 16), # Set text size for all elements
plot.title = element_text(size = 20), # Set title size
axis.title = element_text(size = 18), # Set axis title size
axis.text = element_text(size = 19)) # Set axis text size
Challenge 3: Make it professional with themes!#
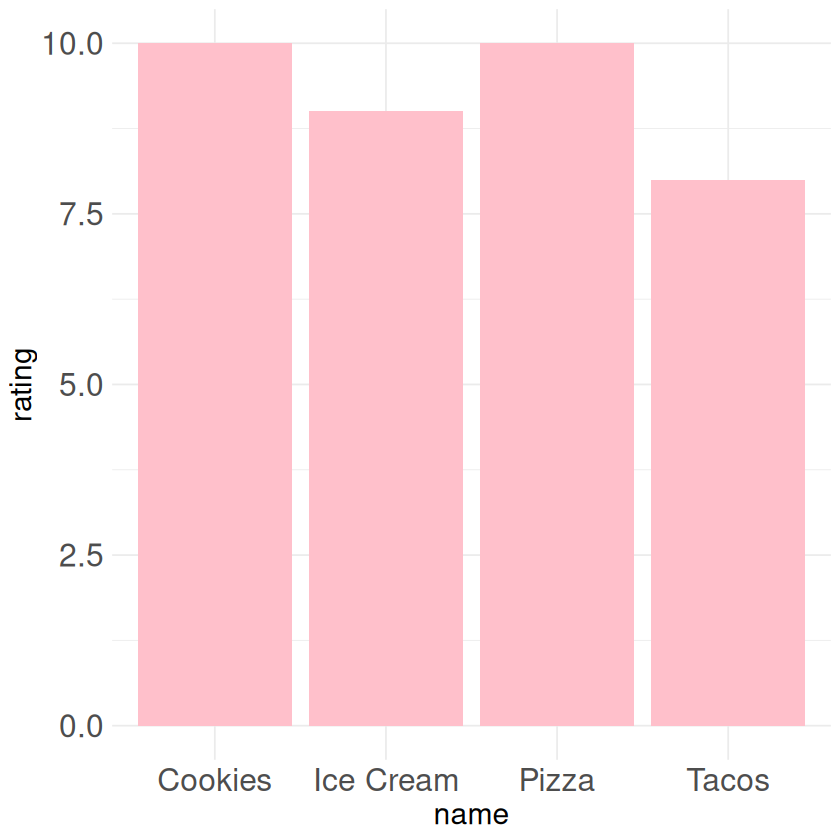
ggplot(my_data, aes(x = name, y = rating)) +
  geom_col(fill = "pink") +
  theme_minimal() +
  theme(text = element_text(size = 16),  # Set text size for all elements
        plot.title = element_text(size = 20), # Set title size
        axis.title = element_text(size = 18), # Set axis title size
        axis.text = element_text(size = 19)) # Set axis text size
Challenge 4: Add titles and labels#
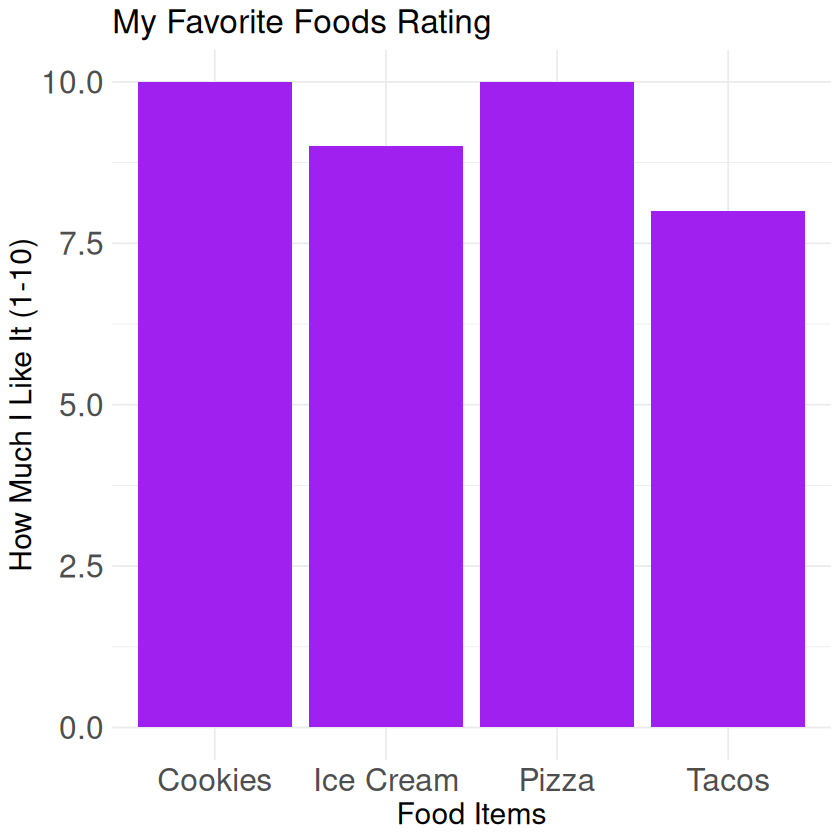
ggplot(my_data, aes(x = name, y = rating)) +
  geom_col(fill = "purple") +
  theme_minimal() +
  labs(
    title = "My Favorite Foods Rating",
    x = "Food Items",
    y = "How Much I Like It (1-10)"
  ) +
  theme(text = element_text(size = 16),  # Set text size for all elements
        plot.title = element_text(size = 20), # Set title size
        axis.title = element_text(size = 18), # Set axis title size
        axis.text = element_text(size = 19)) # Set axis text size
Challenge 5: Color by category#
ggplot(my_data, aes(x = name, y = rating, fill = category)) +
  geom_col() +
  theme_minimal() +
  labs(title = "My Food Ratings by Category") +
  theme(text = element_text(size = 16),  # Set text size for all elements
        plot.title = element_text(size = 20), # Set title size
        axis.title = element_text(size = 18), # Set axis title size
        axis.text = element_text(size = 19)) # Set axis text size
Key Learning:
Use your own dataframes with ggplot2 to create beautiful charts
fill = "color"changes bar colorstheme_minimal()makes charts look clean and professionallabs()adds titles and labels to make charts easier to understandYour data can become art - experiment with different styles!