DSCI 512 Lecture 3 : Graphs and Sparse Matrices
Sky (Kehan) Sheng
Housekeeping: labs
“Single Attempt” on a lab question means one attempt per variant. You get unlimited attempts per question.
![PrairieLearn question footer showing Save & Grade (Single attempt) and the message: Additional attempts available with new variants]()
New: the Jupyter scratchpad has starter code for every coding question. Play with the data and test your code there before you submit on PL.
Week 1 practice problems are on PL. Keep practising as you study.
Housekeeping: live coding quizzes
- The goal is a safe space to make mistakes and practise before a real technical interview.
- Go to your own lab session. Bring your UBC ID, or show your photo on Canvas or Workday.
- Each quiz covers the previous week. This week: Week 1, binary and linear search.
- Grade by attempts: the first 5 attempts get full marks, the next 5 get 4, the next 5 get 3, then 2, then 1.
- Retakes: up to two extra tries, closed-book, new questions but on the same concepts. During any TA or instructor office hours, before November 6.
Image generated by OpenAI GPT-image-2.5-sunburst
Where we stopped last time
The rest of lecture 2 shrinks Instagram’s user table about 10× by picking the right dtypes. Read it on your own: lecture 2 slides.
How does Instagram know who you might know?
You open Instagram. A card says Suggested for you: nori.
You have never met nori, but the card says Followed by clam, kelp and mochi.

Out of 3 billion users, how did Instagram pick nori? 🤔
Image generated by OpenAI GPT-image-2.5-sunburst
Draw it
{
  // Draw only: every position, colour role and label was computed in Python.
  const s = suggest_steps[suggest_step];
  const base = friend_layout;
  const fill = {you: "#52514e", friend: "#2a78d6", pick: "#eb6834", other: "#b8b6b0"};
  const stroke = {friend: "#2a78d6", path: "#eb6834", base: "#d9d8d4"};
  const nodes = base.nodes.map((d, i) => ({...d, role: s.node_roles[i], label: s.labels[i]}));
  const edges = s.show_edges ? base.edges.map((d, i) => ({...d, role: s.edge_roles[i]})) : [];
  return Plot.plot({
    width: 900, height: 390, margin: 20,
    style: {fontSize: "16px", background: "transparent"},
    x: {axis: null, domain: base.x_domain}, y: {axis: null, domain: base.y_domain},
    marks: [
      Plot.link(edges, {filter: d => d.role === "base", x1: "x1", y1: "y1", x2: "x2", y2: "y2",
                        stroke: stroke.base, strokeWidth: 2}),
      Plot.link(edges, {filter: d => d.role !== "base", x1: "x1", y1: "y1", x2: "x2", y2: "y2",
                        stroke: d => stroke[d.role], strokeWidth: 4}),
      Plot.dot(nodes, {x: "x", y: "y", r: 14, fill: d => fill[d.role], stroke: "white", strokeWidth: 2}),
      Plot.text(nodes, {x: "x", y: "y", text: "label", dy: -25, fontWeight: "bold"})
    ]
  });
}
Users and lines between them: this is called a graph.
Graph, defined
A graph \(G = (V, E)\) has
- \(V\), a set of vertices (also called nodes): the users.
- \(E\), a set of edges: the friendships. Each edge \((u, v)\) connects two vertices \(u, v \in V\).
Many kinds of data are graphs:
| data | vertices | edges |
|---|---|---|
| social network | people | who is friends with whom |
| the internet | web pages | which page links to which |
| transportation | cities | direct flights |
| MDS courses | courses | which course you need first |
Build it in networkx
One at a time: G.add_node("ada"), G.add_edge("sky", "otter"). Many at once: add_nodes_from, add_edges_from.
Neighbours and degree
- \(u\) and \(v\) are neighbours if there is an edge between them.
- The degree of a vertex is the number of edges touching it.
{
  // Draw only: roles were computed in Python (user_views).
  const s = user_views[deg_who];
  const base = friend_layout;
  const fill = {you: "#52514e", friend: "#2a78d6", pick: "#eb6834", other: "#b8b6b0"};
  const nodes = base.nodes.map((d, i) => ({...d, role: s.node_roles[i]}));
  const edges = base.edges.map((d, i) => ({...d, role: s.edge_roles[i]}));
  return html`${Plot.plot({
    width: 600, height: 300, margin: 16,
    style: {fontSize: "15px", background: "transparent"},
    x: {axis: null, domain: base.x_domain}, y: {axis: null, domain: base.y_domain},
    marks: [
      Plot.link(edges, {filter: d => d.role === "base", x1: "x1", y1: "y1", x2: "x2", y2: "y2",
                        stroke: "#d9d8d4", strokeWidth: 2}),
      Plot.link(edges, {filter: d => d.role !== "base", x1: "x1", y1: "y1", x2: "x2", y2: "y2",
                        stroke: "#2a78d6", strokeWidth: 4}),
      Plot.dot(nodes, {x: "x", y: "y", r: 11, fill: d => fill[d.role], stroke: "white", strokeWidth: 2}),
      Plot.text(nodes, {x: "x", y: "y", text: "id", dy: -20, fontWeight: "bold"})
    ]
  })}<div class="ojs-readout">${s.degree_say}</div>`;
}
Paths and distance
{
  // Draw only: the shortest path was found in Python (path_lookup).
  const s = path_lookup[`${path_from}|${path_to}`];
  const base = friend_layout;
  const nodes = base.nodes.map((d, i) => ({...d, role: s.node_roles[i]}));
  const edges = base.edges.map((d, i) => ({...d, role: s.edge_roles[i]}));
  return html`<div class="ojs-readout">${s.say}</div>${Plot.plot({
    width: 820, height: 270, margin: 14,
    style: {fontSize: "16px", background: "transparent"},
    x: {axis: null, domain: base.x_domain}, y: {axis: null, domain: base.y_domain},
    marks: [
      Plot.link(edges, {filter: d => d.role === "base", x1: "x1", y1: "y1", x2: "x2", y2: "y2",
                        stroke: "#d9d8d4", strokeWidth: 2}),
      Plot.link(edges, {filter: d => d.role !== "base", x1: "x1", y1: "y1", x2: "x2", y2: "y2",
                        stroke: "#eb6834", strokeWidth: 5}),
      Plot.dot(nodes, {x: "x", y: "y", r: 12, fill: d => d.role === "pick" ? "#eb6834" : "#b8b6b0",
                       stroke: "white", strokeWidth: 2}),
      Plot.text(nodes, {x: "x", y: "y", text: "id", dy: -22, fontWeight: "bold"})
    ]
  })}`;
}- A path is a sequence of vertices joined by edges. Its length is the number of edges.
- The shortest one is the distance: “degrees of separation”.
- A cycle is a path that starts and ends at the same vertex: sky → clam → kelp → sky.
Shortest path in code
How does networkx find it? Breadth-first search, next lecture.
Connected or not?
{
  // Draw only: the components were found in Python (component_view).
  const s = component_view;
  const base = friend_layout;
  const color = {friend: "#2a78d6", pick: "#eb6834"};
  const nodes = base.nodes.map((d, i) => ({...d, role: s.node_roles[i]}));
  const edges = base.edges.map((d, i) => ({...d, role: s.edge_roles[i]}));
  return html`${Plot.plot({
    width: 820, height: 300, margin: 16,
    style: {fontSize: "16px", background: "transparent"},
    x: {axis: null, domain: base.x_domain}, y: {axis: null, domain: base.y_domain},
    marks: [
      Plot.link(edges, {x1: "x1", y1: "y1", x2: "x2", y2: "y2", stroke: d => color[d.role], strokeWidth: 3}),
      Plot.dot(nodes, {x: "x", y: "y", r: 12, fill: d => color[d.role], stroke: "white", strokeWidth: 2}),
      Plot.text(nodes, {x: "x", y: "y", text: "id", dy: -22, fontWeight: "bold"})
    ]
  })}<div class="ojs-readout">${s.say}</div>`;
}- Connected: there is a path between every pair of vertices.
- Our graph is disconnected: no path from sky to waffle. Instagram can’t suggest waffle through friends.
- Each separate group is a connected component.
Connected components in code
iClicker: how many edges?
A group chat of \(V\) users where everyone follows everyone. This is a complete graph: every pair of vertices has an edge.
How many edges does it have?
- (A) \(V - 1\)
- (B) \(V\)
- (C) \(\frac{V(V-1)}{2}\)
- (D) \(V^2\)
- Answer: C
- Each user has degree \(V - 1\). Adding up all \(V\) degrees counts every edge twice, once from each end.
Check it
{
  // Draw only: positions, edges and the sentence were computed in Python (complete_views).
  const s = complete_views[complete_n];
  return html`<div class="ojs-readout">${s.say}</div>${Plot.plot({
    width: 420, height: 380, margin: 20,
    style: {fontSize: "16px", background: "transparent"},
    x: {axis: null, domain: s.x_domain}, y: {axis: null, domain: s.y_domain},
    marks: [
      Plot.link(s.edges, {x1: "x1", y1: "y1", x2: "x2", y2: "y2", stroke: "#2a78d6", strokeWidth: 2}),
      Plot.dot(s.nodes, {x: "x", y: "y", r: 12, fill: "#2a78d6", stroke: "white", strokeWidth: 2}),
      Plot.text(s.nodes, {x: "lx", y: "ly", text: "id", fontWeight: "bold"})
    ]
  })}`;
}
About half of \(V^2\): a complete graph has \(O(V^2)\) edges. Keep this in mind for memory.
Graph types
Instagram followers are one-way
- Undirected: an edge goes both ways. Facebook friends: if Alice is friends with Bob, Bob is friends with Alice.
- Directed: an edge has a direction, drawn as an arrow. Instagram followers: You can follow natgeo without natgeo following you.
Degree splits in two:
- in-degree: arrows in, followers
- out-degree: arrows out, following
{
  // Draw only: arrows and degrees were computed in Python (follow_view).
  const s = follow_view.lookup[follow_who];
  const color = {in: "#2a78d6", out: "#eb6834", base: "#c9c7c1"};
  const nodes = follow_view.nodes.map((d, i) => ({...d, role: s.node_roles[i]}));
  const arrows = follow_view.arrows.map((d, i) => ({...d, role: s.edge_roles[i]}));
  return html`${Plot.plot({
    width: 520, height: 330, margin: 16,
    style: {fontSize: "16px", background: "transparent"},
    x: {axis: null, domain: follow_view.x_domain}, y: {axis: null, domain: follow_view.y_domain},
    marks: [
      Plot.arrow(arrows, {x1: "x1", y1: "y1", x2: "x2", y2: "y2", stroke: d => color[d.role],
                          strokeWidth: 3, insetStart: 16, insetEnd: 16, headLength: 12}),
      Plot.dot(nodes, {x: "x", y: "y", r: 13, fill: d => d.role === "you" ? "#52514e" : "#b8b6b0",
                       stroke: "white", strokeWidth: 2}),
      Plot.text(nodes, {x: "x", y: "y", text: "id", dy: -24, fontWeight: "bold"})
    ]
  })}<div class="ojs-readout">${follow_who}: <span class="notify">${s.in_say}</span>,
    <span class="match">${s.out_say}</span></div>`;
}
Directed graphs in code
Weighted graphs
Weighted: every edge carries a number. Unweighted: an edge either exists or it doesn’t.
{
  // Draw only: widths and label positions were computed in Python (weighted.dm).
  const w = weighted.dm;
  return Plot.plot({
    width: 460, height: 300, margin: 10,
    style: {fontSize: "16px", background: "transparent"},
    x: {axis: null, domain: w.x_domain}, y: {axis: null, domain: w.y_domain},
    marks: [
      Plot.link(w.lines, {x1: "x1", y1: "y1", x2: "x2", y2: "y2", stroke: "#2a78d6", strokeWidth: "width"}),
      Plot.text(w.lines, {x: "lx", y: "ly", text: "weight", fontWeight: "bold",
                          stroke: "white", strokeWidth: 5, fill: "#0b0b0b"}),
      Plot.dot(w.nodes, {x: "x", y: "y", r: 13, fill: "#b8b6b0", stroke: "white", strokeWidth: 2}),
      Plot.text(w.nodes, {x: "x", y: "y", text: "id", dy: -24, fontWeight: "bold"})
    ]
  });
}
Undirected: one number per pair. Weight = number of mutual friends, 12 mutual friends between sky and otter.
{
  // Draw only: widths and label positions were computed in Python (weighted.likes).
  const w = weighted.likes;
  return Plot.plot({
    width: 460, height: 300, margin: 10,
    style: {fontSize: "16px", background: "transparent"},
    x: {axis: null, domain: w.x_domain}, y: {axis: null, domain: w.y_domain},
    marks: [
      Plot.arrow(w.lines, {x1: "x1", y1: "y1", x2: "x2", y2: "y2", stroke: "#eb6834",
                           strokeWidth: "width", insetStart: 16, insetEnd: 18, headLength: 5}),
      Plot.text(w.lines, {x: "lx", y: "ly", text: "weight", fontWeight: "bold",
                          stroke: "white", strokeWidth: 5, fill: "#0b0b0b"}),
      Plot.dot(w.nodes, {x: "x", y: "y", r: 13, fill: "#b8b6b0", stroke: "white", strokeWidth: 2}),
      Plot.text(w.nodes, {x: "x", y: "y", text: "id", dy: -24, fontWeight: "bold"})
    ]
  });
}
Directed: one number per direction. Weight = likes given: sky liked otter 40 times, otter liked sky only 3 times.
Weighted graphs in code
Question: which kind of graph?
A soccer league: two teams are connected if they played each other, labelled with how many games they played.
- (A) undirected, unweighted
- (B) undirected, weighted
- (C) directed, unweighted
- (D) directed, weighted
- Answer: B. A game involves both teams, so there is no direction, and the number of games is the weight.
How do we store a graph?
Two standard ways: an adjacency list and an adjacency matrix. The list is a dict, so first a short detour.
A plain dict and a missing key
Who liked your posts today? Count the likes per user.
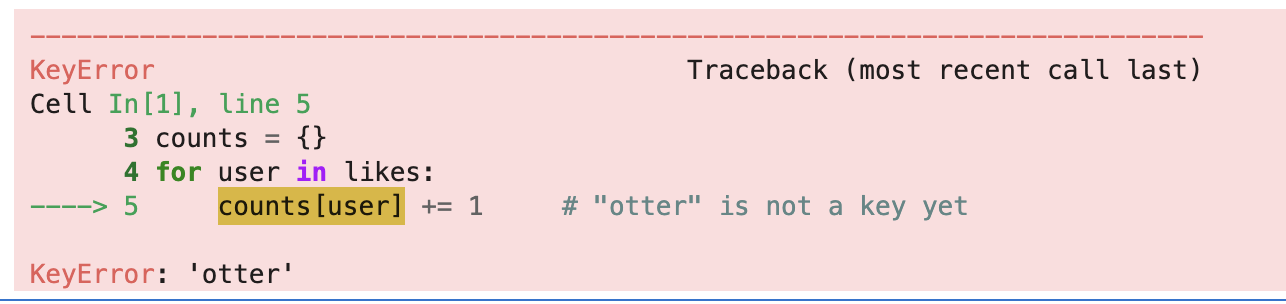
You have to check every key yourself:
defaultdict does the check for you
defaultdict(f) calls f() to make the value for a key it has not seen yet.
int to count, list to group, set to collect unique items.
Two things to watch
⚠️ Just looking at a missing key adds it:
Why defaultdict(list) and not defaultdict(list())?
defaultdictneeds a function it can call for every missing key.listis that function.list()is one empty list that already exists. It raises aTypeError.
Counter is made for counting
How many r’s are in “strawberry”? One line.
| you want to… | use |
|---|---|
| look things up, every key known up front | dict |
| group items under a key | defaultdict(list) or defaultdict(set) |
| count things | Counter or defaultdict(int) |
Adjacency list
For every user, keep a list of their friends: a dict of lists.
Directed graph? Drop the second append: an edge from u to v only goes in u’s list.
Adjacency list with networkx
Edge lists often come as a table. nx.from_pandas_edgelist turns one into a graph:
iClicker: space of an adjacency list
What is the space complexity of an adjacency list, with \(V\) vertices and \(E\) edges?
- (A) \(O(V)\)
- (B) \(O(E)\)
- (C) \(O(VE)\)
- (D) \(O(V + E)\)
- Answer: D
- One key per vertex: \(O(V)\). Each edge appears once, or twice if undirected: \(O(E)\).
- Not \(O(E)\): a graph can have vertices and no edges. Not \(O(V^2)\): most graphs are far from complete.
Adjacency matrix
Number the vertices \(1, \dots, V\). The adjacency matrix \(A\) is \(V \times V\):
\[a_{ij} = \begin{cases} 1, & \text{if there is an edge from } i \text{ to } j \\ 0, & \text{otherwise} \end{cases}\]
Same graph, two ways
{
  // Draw only: the graph roles, the list lines and the matrix rows were computed in Python.
  const s = user_views[adj_who];
  const base = friend_layout;
  const fill = {you: "#52514e", friend: "#2a78d6", other: "#b8b6b0"};
  const nodes = base.nodes.map((d, i) => ({...d, role: s.node_roles[i]}));
  const edges = base.edges.map((d, i) => ({...d, role: s.edge_roles[i]}));
  const graph = Plot.plot({
    width: 290, height: 240, margin: 12,
    style: {fontSize: "13px", background: "transparent"},
    x: {axis: null, domain: base.x_domain}, y: {axis: null, domain: base.y_domain},
    marks: [
      Plot.link(edges, {filter: d => d.role === "base", x1: "x1", y1: "y1", x2: "x2", y2: "y2",
                        stroke: "#d9d8d4", strokeWidth: 1.5}),
      Plot.link(edges, {filter: d => d.role !== "base", x1: "x1", y1: "y1", x2: "x2", y2: "y2",
                        stroke: "#2a78d6", strokeWidth: 3}),
      Plot.dot(nodes, {x: "x", y: "y", r: 7, fill: d => fill[d.role], stroke: "white", strokeWidth: 1.5}),
      Plot.text(nodes, {x: "x", y: "y", text: "id", dy: -14, fontWeight: "bold"})
    ]
  });
  const list = adj_view.lines.map((line, i) => html`<div class="${s.list_cls[i]}">${line}</div>`);
  const header = html`<tr><th></th>${adj_view.short.map(h => html`<th>${h}</th>`)}</tr>`;
  const rows = adj_view.rows.map((row, i) => html`<tr class="${s.row_cls[i]}">
      <th>${adj_view.short[i]}</th>${row.map(v => html`<td class="${v ? "one" : ""}">${v}</td>`)}</tr>`);
  return html`<div class="adj-wrap">
      <div class="adj-panel">${graph}<div class="ds-caption">graph</div></div>
      <div class="adj-panel"><div class="adj-list">${list}</div><div class="ds-caption">adjacency list</div></div>
      <div class="adj-panel"><table class="adj-table">${header}${rows}</table><div class="ds-caption">adjacency matrix</div></div>
    </div>
    <div class="ojs-readout">${s.matrix_say}</div>`;
}Reading the matrix
- Row sum = degree.
- Undirected, so \(a_{ij} = a_{ji}\): symmetric. A directed graph’s matrix usually isn’t.
- Is there an edge? One lookup,
A[i, j]: \(O(1)\).
Question: space of an adjacency matrix
- (A) \(O(VE)\)
- (B) \(O(E^2)\)
- (C) \(O(V^2)\)
- (D) \(O(V + E)\)
- Answer: C. One number per pair of vertices, edge or not.
Directed: read it off the matrix
The follow graph from earlier, as a matrix:
| row follows column | sky | otter | clam | kelp | natgeo |
|---|---|---|---|---|---|
| sky | 0 | 1 | 0 | 0 | 1 |
| otter | 1 | 0 | 0 | 0 | 1 |
| clam | 0 | 0 | 0 | 0 | 1 |
| kelp | 1 | 0 | 0 | 0 | 0 |
| natgeo | 0 | 0 | 0 | 0 | 0 |
- Who follows whom? Draw it on paper.
- Is it symmetric? No: sky → natgeo is a 1, natgeo → sky is a 0.
- Only sky and otter have a 1 both ways: they follow each other.
Which one to use?
| adjacency list | adjacency matrix | |
|---|---|---|
| space | \(O(V + E)\) | \(O(V^2)\) |
| is there an edge from \(u\) to \(v\)? | \(O(\text{degree of } u)\), \(O(V)\) worst case | \(O(1)\): A[u, v] |
| all neighbours of \(u\) | \(O(\text{degree of } u)\) | \(O(V)\): scan the row |
| good for | big graphs with few edges | small or dense graphs |
A trick from lecture 2: store neighbours in a set, and the edge check is \(O(1)\) on average. networkx does this: a graph is a dict of dicts.
Can we have both?
- A sparse matrix gets close to both.
networkxalready uses one:
Sparse matrices
Store only the friendships, not the 3 billion “no”s.
“Sparse matrix” means two things
- In maths: a matrix that is mostly zeros.
- In code: a data structure that stores only the non-zero entries.
- Use the data structure when your matrix is mostly zeros.
Our friend graph, stored sparse
How much memory does it save?
A random graph with 100,000 users, where each possible friendship exists with probability 0.0001:
G_big = nx.fast_gnp_random_graph(100_000, 1e-4, seed=512)
am_big = nx.adjacency_matrix(G_big)

V = G_big.number_of_nodes()
E = G_big.number_of_edges()
print(f"V = {V:,} users, E = {E:,} friendships, nnz = {am_big.nnz:,}")

dense_bytes = V**2 * 8                                                    # every entry, 8 bytes each
sparse_bytes = am_big.data.nbytes + am_big.indices.nbytes + am_big.indptr.nbytes   # only what is stored
print(f"dense:  {dense_bytes / 1e9:,.1f} GB")
print(f"sparse: {sparse_bytes / 1e6:,.1f} MB")
V = 100,000 users, E = 499,519 friendships, nnz = 999,038
dense: 80.0 GB
sparse: 16.8 MBThe formula
At 8 bytes per number, for an undirected graph:
| what is stored | bytes | space | |
|---|---|---|---|
| dense matrix | all \(V^2\) entries | \(8V^2\) | \(O(V^2)\) |
| sparse matrix (CSR) | data + indices + indptr |
\(8 \times (\text{nnz} + \text{nnz} + V + 1)\) | \(O(V + E)\) |
with \(\text{nnz} = 2E\).
Same space complexity as an adjacency list, and that is no coincidence.
The three arrays of CSR
CSR = Compressed Sparse Row. Walk the matrix row by row and keep only the non-zeros, in three arrays.
data: the non-zero values, row 0 first.nnzof them.indices: the column of each value indata.nnzof them.indptr: how many non-zeros come before each row, which is also where the row starts indata. \(V + 1\) of them.
indptr starts at 0, ends at nnz, and row \(i\) is data[indptr[i]:indptr[i+1]].
How CSR stores a matrix
Click through the rows and watch the three arrays fill in.
{
  // Draw only: the arrays and the highlights were computed in Python (csr_view).
  const s = csr_view.steps[csr_row];
  const header = html`<tr><th></th>${csr_view.col_labels.map(h => html`<th>${h}</th>`)}</tr>`;
  const rows = s.rows.map((r, i) => html`<tr class="${r.cls}"><th>row ${i}</th>
      ${r.cells.map(c => html`<td class="${c.cls}">${c.v}</td>`)}</tr>`);
  const nnzRows = s.nnz.map(r => html`<tr class="${r.cls}"><td>${r.v}</td></tr>`);
  const boxes = items => items.map(b =>
    html`<div class="ds-box ${b.cls}">${b.label}<span class="sq-tag below">${b.tag}</span></div>`);
  return html`<div class="adj-wrap csr-wrap">
      <div class="adj-panel"><table class="adj-table">${header}${rows}</table>
        <div class="ds-caption">the matrix</div></div>
      <div class="adj-panel"><table class="adj-table">
          <tr><th>non-zeros</th></tr>${nnzRows}</table>
        <div class="ds-caption">count per row</div></div>
      <div class="adj-panel">
        <div class="ds-row csr"><span class="csr-name">data</span>${boxes(s.data)}</div>
        <div class="ds-row csr"><span class="csr-name">indices</span>${boxes(s.indices)}</div>
        <div class="ds-row csr"><span class="csr-name">indptr</span>${boxes(s.indptr)}</div>
        <div class="ds-caption">what CSR stores (small numbers: position in the array)</div></div>
    </div>
    <div class="ojs-readout">${s.say.join(" ")}</div>`;
}Today’s cheat sheet
Storing a graph with \(V\) vertices and \(E\) edges:
| representation | space | edge from \(u\) to \(v\)? | neighbours of \(u\) | use it when |
|---|---|---|---|---|
| adjacency list (dict of lists) | \(O(V + E)\) | \(O(\text{degree of } u)\) | \(O(\text{degree of } u)\) | the graph is big, has few edges, or changes often |
| adjacency matrix (NumPy) | \(O(V^2)\) | \(O(1)\) | \(O(V)\) | the graph is small, or most pairs are connected |
| sparse matrix (CSR) | \(O(V + E)\) | \(O(\text{degree of } u)\) | \(O(\text{degree of } u)\) | the graph is big and you want matrix maths |
Today’s takeaways
- A graph is vertices plus edges. Directed or not, weighted or not.
networkx:G.neighbors(v),G.degree(v),nx.shortest_path_length(G, u, v),nx.connected_components(G).defaultdictfills in missing keys,Countercounts a whole list in one step.- Adjacency list: \(O(V + E)\). Adjacency matrix: \(O(V^2)\). Real graphs have far fewer than \(V^2\) edges.
- A sparse matrix stores only the non-zeros. CSR is fast at rows, CSC at columns. Never
.toarray()a big one.
Questions?