DSCI 512 Lecture 2 : Space Complexity and Basic Data Structures
Sky (Kehan) Sheng
How does coat checking work?
You hand your coat to the attendant at a busy restaurant. 300 coats are already back there.
Two hours later you come back, and they walk off and return with your coat in a few seconds.

How? 🤔
Pile them up. Look at every coat, one by one, until yours turns up?
Image generated by OpenAI GPT-image-2.5-sunburst
Keep cutting the rack in half
Image generated by OpenAI GPT-image-2.5-sunburst
Cut the rack in half
The rack is in ticket-number order. Your ticket says #217.
{
// Draw only: every step below was computed in Python (bs_runs).
const run = bs_runs[bs_n];
const s = run.steps[Math.min(bs_step, run.steps.length - 1)];
const done = bs_step >= run.steps.length - 1;
const boxes = run.labels.map((label, i) =>
html`<div class="ds-box ${s.cells[i]}">${label}</div>`);
return html`<div class="ojs-readout">${s.lead}
<span class="${done ? "notify" : "match"}">${s.ticket}</span>.
${s.rest}</div>
<div class="ds-row bs-rack">${boxes}</div>
<div class="ojs-readout">${done ? html`<b class="match">${run.tally}</b>` : html` `}</div>`;
}This is called Binary Search!
iClicker: what is the run time of binary search?
Halving a rack of \(n\) coats until one coat is left:
- (A) \(O(1)\)
- (B) \(O(\log n)\)
- (C) \(O(n)\)
- (D) \(O(n \log n)\)
- Answer: B
- 1 look leaves \(n/2\), 2 looks leave \(n/4\), \(k\) looks leave \(n/2^k\).
- We stop when \(n/2^k = 1\), so \(2^k = n\), so \(k = \log_2 n\).
What does \(\log n\) actually mean?
\(\log_2 n\) asks: how many times can I halve \(n\) before I get down to 1?
| what happens to the computation time | |
|---|---|
| \(O(2^n)\), add 1 to \(n\) | the computation time doubles |
| \(O(\log n)\), double \(n\) | the computation time goes up by 1 |
| coats on the rack | 300 | 1,000 | 1 million | 3 billion |
|---|---|---|---|---|
| looks needed | 9 | 10 | 20 | 32 |
- Exponential and logarithmic growth are mirror images of each other.
- Log and exponent rules: Math cheatsheet
Does the base of the log matter?
You may have noticed that we do not write out the base of the log usually, that’s because:
\[\log_2 n \;=\; \frac{\log_{10} n}{\log_{10} 2} \;=\; {\log_{2} 10} \times \log_{10} n\]
- Changing the base only multiplies by a constant, and Big O throws constant factors away.
- Change of base: Math cheatsheet
So we write \(O(\log n)\) and never say which base.
Today’s story: How does Instagram manage 3 billion users?
Image generated by OpenAI GPT-image-2.5-sunburst
How does Instagram check if your username already exists?
You open Instagram and type a username: @otter_eats_clams
- After you finish typing, a green check ✅ appears: this username is available.
- Instagram has about 3 billion users.
- Checking your guess against 3 billion usernames, if we use linear search (going through the entire list one by one): even 1 ms each, it would take about 5 weeks!
- But the check completes instantly. How? 🤔
Instagram user count: TechnologyChecker.io, 2026
Today, you are Instagram’s data scientist!
Your first task: make the username check instant.
Where should Instagram keep 3 billion usernames, so that “is this username taken?” is answered instantly?
Which data structure should we use to store the usernames?
Python’s four built-in data structures
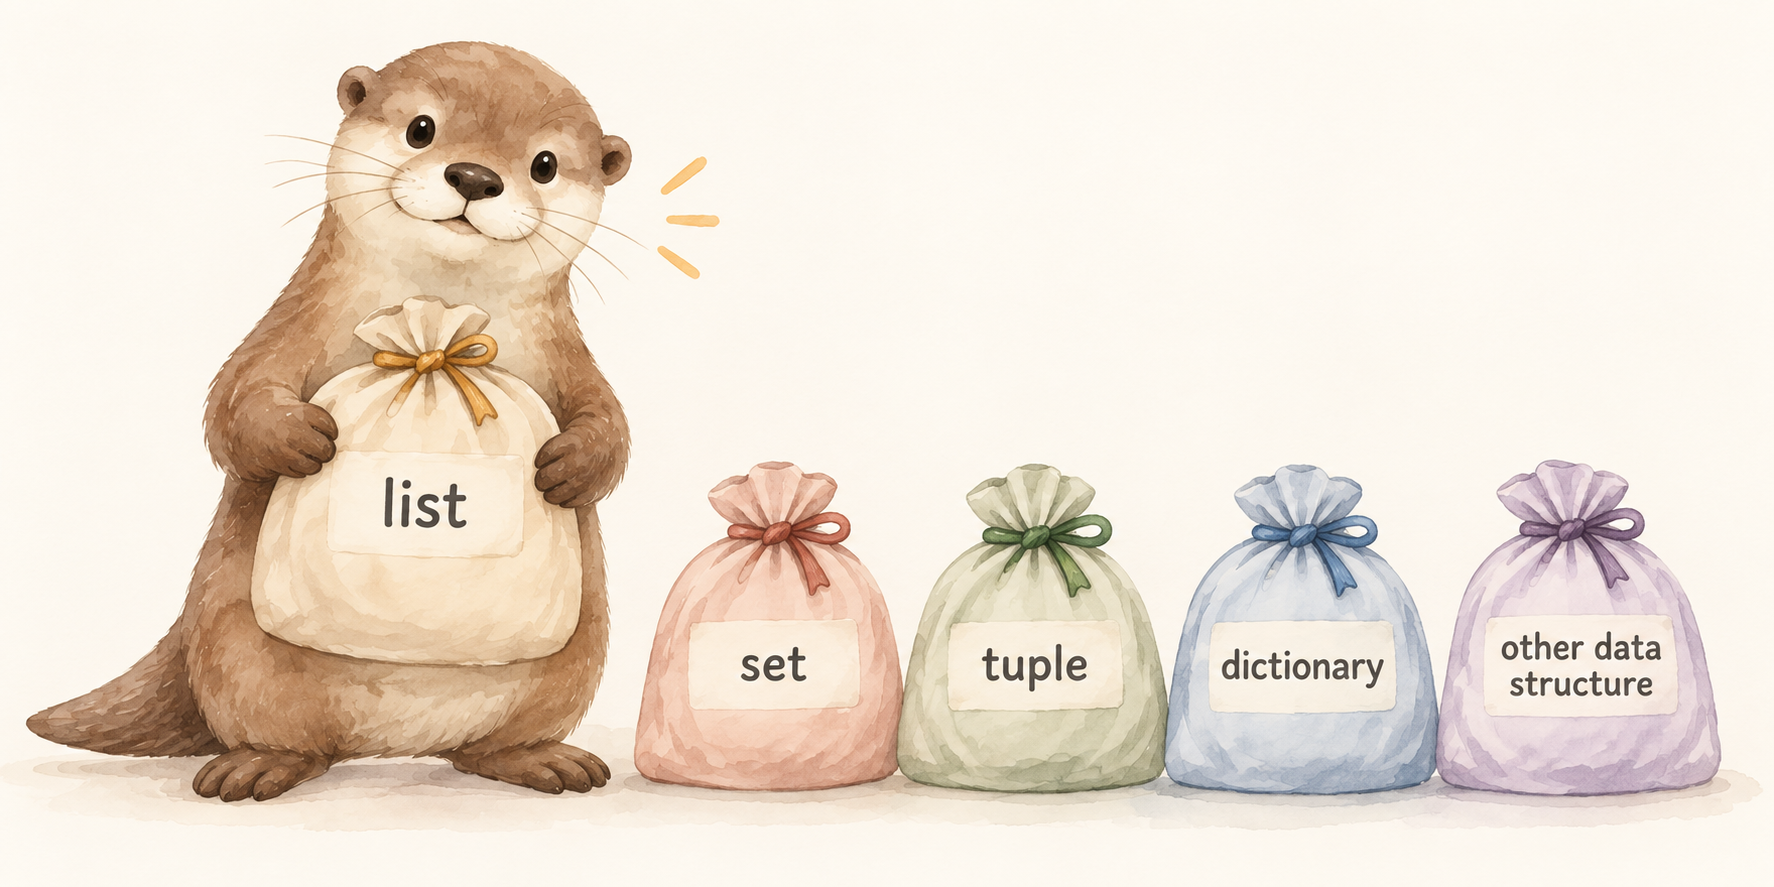
A data structure is a way to organize data. It is the arrangement, not the data.
list |
tuple |
set |
dict |
|
|---|---|---|---|---|
| syntax | [1, 2, 3] |
(1, 2, 3) |
{1, 2, 3} |
{"a": 1} |
| ordered? | yes | yes | no | yes (insertion) |
| mutable? | yes | no | add / remove only | yes |
| duplicates? | allowed | allowed | never | keys no, values yes |
- Full refresher with examples: Python cheatsheet
Image generated by OpenAI GPT-image-2.5-sunburst
There are 3 things that we need to do when managing Instagram’s usernames
- Insert: A new user signs up.
- Delete: A user deletes their account.
- Search: Check if this username is taken.
As a good data scientist, you will ask: how fast can I insert, delete, and search the usernames when using different data structures?
How about list?
- Insert:
usernames.append(name)is \(O(1)\). ✅ - Search:
inlooks at every name until it finds a match: \(O(n)\). At 1 ms per name, still takes about 5 weeks. ❌ - Delete: find the name first, then shift everything after it: \(O(n)\). ❌
What about a sorted list?
Keep the usernames in alphabetical order, like the coat rack in ticket order.
- Search: binary search, \(O(\log n)\). Only \(\log_2(3 \times 10^9) \approx\) 32 comparisons. ✅
- Insert: a new sign-up must be slotted into the right place, shifting everything after it: \(O(n)\). ❌
- Delete: same shifting problem: \(O(n)\). ❌
Instagram gets new sign-ups every second, so a sorted list has to stay sorted. Too slow.
How about tuple?
- A tuple is immutable: no
append, noremove. ❌ - Every sign-up would have to build a brand-new tuple of 3 billion names: \(O(n)\).
- Search is still
in, one by one: \(O(n)\). ❌
How about set?
- Insert
usernames.add(name), deleteusernames.remove(name), searchname in usernames: all \(O(1)\). ✅ - \(O(1)\) means the time does not depend on how many usernames are stored. 10 usernames or 3 billion, same speed.
- A set never stores duplicates, and usernames must be unique anyway. ✅
Remember lecture 1? Searching a set was far faster than searching a list:
How can a set be that fast?
Because a set is actually a hash table. We use something called a hash function to map the username to a position number to look for in the hash table!
A hash function you can do in your head
Add up the position of each letter in the alphabet (\(a=1\), \(b=2\), …, \(z=26\)):
Then squash it into a bucket number with % (the remainder after dividing):
Watch a username find its bucket
{
  // Draw only: the buckets below were computed in Python (bucket_demo).
  const m = bucket_demo[`${n_buckets}|${who}`];
  const wall = m.buckets.map((names, i) => html`<div class="bucket ${i === m.index ? "target" : ""}">
      <div class="bucket-id">bucket ${i}</div>
      ${names.map(name => html`<div class="bucket-item ${name === who ? "landed" : ""}">${name}</div>`)}
    </div>`);
  return html`<div class="bucket-wall">${wall}</div>`;
}
{
// Read only: every number below was computed in Python (bucket_demo).
const m = bucket_demo[`${n_buckets}|${who}`];
return html`<div class="ojs-readout">To answer "is ${who} taken?" we look in
one bucket and compare against <b class="match">${m.checks_label}</b>,
not all ${m.total} · fullest bucket: ${m.longest} names,
empty buckets: ${m.empty}.</div>`;
}Hash function
A hash function maps data of arbitrary size to a fixed-size value, called a hash value.
Key properties of hash functions
- Deterministic: The same input always produces the same output.
- Within one Python session. Python randomizes string hashes between sessions.
- Fixed-size output: Hash values are of a fixed size (e.g., 64-bit integer), no matter how long the input is.
- Many to one: Many inputs share each output, so the output does not tell you the input. Bucket 3 does not tell you which usernames are in it.
Python’s real hash function
- Notice that
hashreturns an integer.
Not everything can be hashed
- Immutable objects (numbers, strings, tuples of hashable items) are hashable, mutable objects (lists, dicts) are not.
set is a hash table
- Python
setis backed by a hash function, so all elements must be hashable.
- Adding a mutable object such as a list will cause an error.
Hash tables, defined
- A hash table keeps an array of buckets (a list of lists):
- Use a hash function to map an object to an index.
- The object is then added/deleted in the corresponding bucket.
- Insertion, retrieval, and deletion operations are \(O(1)\) time assuming we have a “good” hash function.
A simple hash table
- A simple (but low-quality) implementation of hash table
class HashTable:
    def __init__(self, num_buckets=4):
        self.n = num_buckets

        # A list of lists
        self.stuff = list()
        for i in range(num_buckets):
            self.stuff.append([]) # Create the inner bucket

    def add(self, item):
        if not self.contains(item):
            self.stuff[hash(item) % self.n].append(item)

    def contains(self, item):
        return item in self.stuff[hash(item) % self.n]

    def __str__(self):
        return str(self.stuff)
A simple hash table
- Build the table:
num_bucketsempty buckets
class HashTable:
    def __init__(self, num_buckets=4):
        self.n = num_buckets

        # A list of lists
        self.stuff = list()
        for i in range(num_buckets):
            self.stuff.append([]) # Create the inner bucket

    def add(self, item):
        if not self.contains(item):
            self.stuff[hash(item) % self.n].append(item)

    def contains(self, item):
        return item in self.stuff[hash(item) % self.n]

    def __str__(self):
        return str(self.stuff)
A simple hash table
- Add: find the bucket, append the item (if it isn’t already there)
class HashTable:
    def __init__(self, num_buckets=4):
        self.n = num_buckets

        # A list of lists
        self.stuff = list()
        for i in range(num_buckets):
            self.stuff.append([]) # Create the inner bucket

    def add(self, item):
        if not self.contains(item):
            self.stuff[hash(item) % self.n].append(item)

    def contains(self, item):
        return item in self.stuff[hash(item) % self.n]

    def __str__(self):
        return str(self.stuff)
A simple hash table
- Search: look in one bucket only
class HashTable:
    def __init__(self, num_buckets=4):
        self.n = num_buckets

        # A list of lists
        self.stuff = list()
        for i in range(num_buckets):
            self.stuff.append([]) # Create the inner bucket

    def add(self, item):
        if not self.contains(item):
            self.stuff[hash(item) % self.n].append(item)

    def contains(self, item):
        return item in self.stuff[hash(item) % self.n]

    def __str__(self):
return str(self.stuff)A simple hash table
- Printing: show every bucket
class HashTable:
    def __init__(self, num_buckets=4):
        self.n = num_buckets

        # A list of lists
        self.stuff = list()
        for i in range(num_buckets):
            self.stuff.append([]) # Create the inner bucket

    def add(self, item):
        if not self.contains(item):
            self.stuff[hash(item) % self.n].append(item)

    def contains(self, item):
        return item in self.stuff[hash(item) % self.n]

    def __str__(self):
        return str(self.stuff)
Try it yourself
Registering a username
Is this username taken?
- We only check one bucket instead of the whole list, and if the buckets stay short, that is \(O(1)\).
Hash collisions
- A collision is when two or more inputs (keys) come out of the hash function with the same output (hash), and so land in the same bucket.
- Look at the table we just built: did any two names land in the same bucket?
With 4 names and 4 buckets, a collision happens about 90% of the time.
- Solution (beyond the scope for this course):
- Separate chaining
- Open addressing
So how good is a hash function?
- A good hash function spreads the keys out, so collisions stay rare and each bucket holds a name or two.
- A perfect hash function has no collisions at all. Only possible when you know every key in advance.
- Lots of collisions? Still a hash function, just not a good one. In the worst case every name lands in the same bucket and we are back to searching one long list: \(O(n)\).
Exercise
If my hash table has 4 buckets, what is the time complexity of contains?
A: \(O(1)\)
B: \(O(n)\)
C: \(O(\log n)\)
D: \(O(n \log n)\)
Answer: \(O(n)\). We narrow our search down to one of the 4 buckets, but we still need to search through all the elements in that bucket. Since the size of the bucket is \(\frac{n}{4}\), our time complexity is \(O(n)\).
Hash table growth
- In Python, the size of the hash table (i.e., the array of buckets) expands and contracts dynamically.
- As more elements are inserted, the hash table resizes to avoid excessive collisions.
- Resizing means: build more buckets, then work out a new bucket number for every name already stored.
- That costs \(O(n)\), expensive!
Growth and amortized cost
One bar per insertion: almost all cost 1 step, a few cost a lot.
// Draw only: every cost and average was simulated in Python (growth_chart).
{
  const rows = growth_chart.rows;
  return Plot.plot({
    width: 880, height: 300, marginLeft: 70, marginTop: 24, marginBottom: 46,
    style: {fontSize: "16px", background: "transparent"},
    x: {label: "insertion number →", labelAnchor: "center", ticks: growth_chart.x_ticks, grid: true},
    y: {label: "↑ steps for this insertion", grid: true},
    marks: [
      Plot.barY(rows, {x: "i", y: "cost", fill: d => d.resize ? "#eb6834" : "#b8b6b0"}),
      Plot.line(rows, {x: "i", y: "avg", stroke: "#2a78d6", strokeWidth: 3}),
      Plot.text(growth_chart.resize_labels, {x: "i", y: "cost", text: "resize_label",
                 dy: -10, fontSize: 13, fill: "#eb6834"}),
      Plot.text(growth_chart.avg_label, {x: "i", y: "avg", text: "text",
                 dy: -14, dx: -6, textAnchor: "end", fontWeight: "bold", fill: "#2a78d6"}),
      Plot.ruleY([0])
    ]
  });
}
{
// Read only: every number below was computed in Python (growth_chart).
const g = growth_chart;
return html`<div class="ojs-readout">${g.n} insertions cost ${g.total} steps in total.
The worst single insertion cost <span class="match">${g.worst}</span> steps, but the
<span class="notify">average</span> is ${g.final_avg}, a constant, so insertion is
<b>O(1) amortized</b>.</div>`;
}Python dict
- It is similar to a
setbut with key-value pairs:- The entries are called “keys,” and the associated data are the “values.”
- Python
dictis implemented using a hash table, so we have \(O(1)\) operations like insertion, deletion, and lookup. - Only the keys are hashed, so only the keys have to be hashable.
Today’s cheat sheet
| structure | insert | delete | search | use it when |
|---|---|---|---|---|
list |
\(O(1)\) at the end | \(O(n)\) | \(O(n)\) | order matters, duplicates allowed |
sorted list + binary search |
\(O(n)\) | \(O(n)\) | \(O(\log n)\) | the data is already sorted and rarely changes |
tuple |
not possible | not possible | \(O(n)\) | fixed data, or you need a dict key |
set |
\(O(1)\) | \(O(1)\) | \(O(1)\) | “have I seen this before?” |
dict |
\(O(1)\) | \(O(1)\) | \(O(1)\) (by key) | look something up by name |
set and dict costs are the average case, and list append and hash table insert are amortized. If every key collides, a hash table falls back to \(O(n)\).
Task 2: Space Complexity
Your second task: load the user table onto your laptop. Will 3 billion users even fit in memory?
Image generated by OpenAI GPT-image-2.5-sunburst
Why memory matters
- In Lecture 1, we learned it’s important to consider how long an algorithm takes to run.
- However, another significant concern is how much space (memory, not disk space) it uses.
- Memory (RAM) is where your program keeps the data it is currently working with.
- If your program needs more memory than is available, it will crash (
MemoryError) or slow down dramatically (the computer starts shuffling data to disk). - Unlike a slow program, you often can’t just “wait a bit longer”. It simply does not run.
Checking your own RAM
svmem(total=8323969024, available=6825480192, percent=18.0, used=1498488832, free=3004837888, active=1238421504, inactive=3550760960, buffers=106360832, cached=4096528384, shared=52125696, slab=273113088)- A single number (a
float64) takes 8 bytes. - 8 GB of RAM ÷ 8 bytes ≈ 1.0 billion numbers, if nothing else were running.
- So I can’t run code that needs to hold 3 billion numbers at once.
- Fun fact: GPT-6 is rumored to have approximately 10 trillion parameters.
Space complexity, in Big O
Same notation as last lecture, different question.
| question | what we count | |
|---|---|---|
| Time complexity | how long does it take? | number of steps |
| Space complexity | how much memory does it need? | number of memory units stored |
Same rules as before: drop constant factors, keep the fastest-growing term.
Example 1
One number per user: the follower count of each of the \(n\) users.
- Space complexity: \(O(n)\).
Example 2
One number per pair of users: how close are user \(i\) and user \(j\)?
- Space complexity: \(O(n^2)\).
Example 3
Five numbers per pair of users: likes, comments, DMs, tags, shares.
- Space complexity: \(O(n^2)\).
Example 4
One number per triple of users (how well would these three do in a group chat?).
- Space complexity: \(O(n^3)\).
Example 5
Five numbers, no matter how many users: today’s likes, comments, follows, posts, DMs.
- Space complexity: \(O(1)\).
Example 6
You have \(n\) users on your social network site, and you want to store a “level of friendship” between every pair of users.
Space complexity: \(O(n^2)\).
Will it fit on my laptop?
8 bytes per number. Pick the number of users and watch the three tables grow.
// Draw only: every byte count and label was computed in Python (fit_chart).
{
  const picked = fit_chart.picks[n_users];
  const order = fit_chart.order;                 // legend order, from Python
  return Plot.plot({
    width: 880, height: 300, marginLeft: 80, marginRight: 150, marginBottom: 46,
    style: {fontSize: "16px", background: "transparent"},
    x: {type: "log", label: "number of users →", labelAnchor: "center", grid: true,
        tickFormat: k => fit_chart.choice_labels[k], ticks: fit_chart.choices},
    y: {type: "log", label: "↑ memory needed (bytes)", grid: true, tickFormat: "~s"},
    color: {domain: order, range: ["#2a78d6", "#eb6834", "#4a3aa7"], legend: true, swatchSize: 16},
    marks: [
      Plot.line(fit_chart.curves, {x: "n", y: "bytes", stroke: "c", strokeWidth: 2}),
      Plot.ruleY([fit_chart.ram], {stroke: "#52514e", strokeDasharray: "4 4"}),
      Plot.text([{y: fit_chart.ram}], {x: 10, y: "y", text: () => fit_chart.ram_label,
                                       dy: -10, textAnchor: "start", fill: "#52514e"}),
      Plot.ruleX([n_users], {stroke: "#b8b6b0", strokeDasharray: "4 4"}),
      Plot.dot(picked, {x: "n", y: "bytes", fill: "c", r: 6, stroke: "white", strokeWidth: 2}),
      Plot.text(picked, {x: "n", y: "bytes", text: "size",
                         dx: 10, textAnchor: "start", fontWeight: "bold"})
    ]
  });
}
{
// Print only: every name and number below was computed in Python (fit_chart.max_n).
const classes = ["notify", "match", "cube"]; // same colours as the three lines
return html`<div class="ojs-readout">Largest table that still fits in ${fit_chart.ram_label}:
${fit_chart.max_n.map((m, i) => html`<span class="${classes[i]}">${m.c}</span>
up to <b>${m.n_label}</b> users${i < fit_chart.max_n.length - 1 ? html` · ` : ""}`)}</div>`;
}Measuring memory
Big O predicts. Now let’s measure.
Image generated by OpenAI GPT-image-2.5-sunburst
Four tools
| tool | what it measures |
|---|---|
psutil.virtual_memory() |
how much RAM the whole machine has and is using |
array.nbytes |
the exact bytes of a NumPy array’s data |
sys.getsizeof(obj) |
the bytes of one Python object (shallow) |
df.memory_usage(deep=True) |
the bytes of each pandas column |
⚠️ Memory profiling is less straightforward than timing:
- it is much more dynamic, Python frees memory whenever it feels like it,
- objects can share memory, so the parts don’t always add up to the whole.
nbytes and getsizeof
One follower count per user, for 1 million users:
Same million numbers, very different memory
// Draw only: every size was measured in Python (dtype_chart).
{
  const rows = dtype_chart.rows;
  return Plot.plot({
    width: 880, height: 300, marginLeft: 130, marginTop: 20, marginBottom: 46,
    style: {fontSize: "16px", background: "transparent"},
    x: {label: "memory for 1,000,000 numbers (MB) →", labelAnchor: "center", grid: true},
    y: {label: null, domain: dtype_chart.order},
    color: {domain: dtype_chart.families, range: ["#2a78d6", "#eb6834"], legend: true, swatchSize: 16},
    marks: [
      Plot.barX(rows, {y: "kind", x: "mb", fill: "family", rx: 4}),
      Plot.text(rows, {y: "kind", x: "mb", text: "bar_label",
                       dx: 8, textAnchor: "start", fontWeight: "bold"}),
      Plot.ruleX([0])
    ],
    marginRight: 210
  });
}
{
return html`<div class="ojs-readout">A <span class="match">Python list</span> of 1 million integers uses
<b>${dtype_chart.ratio}×</b> the memory of a <span class="notify">NumPy float64</span> array with the same
numbers · and <b>${dtype_chart.int8_vs_int64}×</b> separates <code>int8</code> from <code>int64</code>.</div>`;
}⚠️ Smaller is not always safe
What happens if a number doesn’t fit?
- 255 + 1 quietly wraps around to 0.
uint8is perfect for age (0 to 120). ✅uint8for follower count would silently break once anyone passed 255 followers. ❌- Choosing a dtype is a promise about the range your data will ever take.
Instagram’s user table
- Let’s assume that we are dealing with the following dataframe:
| user_id | age | followers | country | is_active | signup | |
|---|---|---|---|---|---|---|
| 0 | 0 | 35 | 28476 | Canada | yes | 2021-07-10 |
| 1 | 1 | 24 | 29429 | India | no | 2020-10-17 |
| 2 | 2 | 60 | 30430 | Brazil | yes | 2022-12-30 |
| 3 | 3 | 76 | 14701 | India | yes | 2020-04-12 |
| 4 | 4 | 78 | 10145 | Canada | no | 2020-08-23 |
Two ways to read the same file
or,
def load_tight(path):
    dtype_opt = {
        "user_id": "uint32",       # up to 4.3 billion users
        "age": "uint8",            # 0-255 is plenty
        "followers": "uint32",     # up to 4.3 billion followers
        "country": "category",     # only 5 distinct values
        "is_active": "category",   # only 2 distinct values
    }
return pd.read_csv(path, dtype=dtype_opt, parse_dates=["signup"])Two ways to read the same file
def load_tight(path):
    dtype_opt = {
        "user_id": "uint32",       # up to 4.3 billion users
        "age": "uint8",            # 0-255 is plenty
        "followers": "uint32",     # up to 4.3 billion followers
        "country": "category",     # only 5 distinct values
        "is_active": "category",   # only 2 distinct values
    }
return pd.read_csv(path, dtype=dtype_opt, parse_dates=["signup"])Numbers: ask for the smallest integer type that fits the real range.
Two ways to read the same file
def load_tight(path):
    dtype_opt = {
        "user_id": "uint32",       # up to 4.3 billion users
        "age": "uint8",            # 0-255 is plenty
        "followers": "uint32",     # up to 4.3 billion followers
        "country": "category",     # only 5 distinct values
        "is_active": "category",   # only 2 distinct values
    }
    return pd.read_csv(path, dtype=dtype_opt, parse_dates=["signup"])
Text that repeats: category stores each distinct value once, plus one small number per row.
Two ways to read the same file
def load_tight(path):
    dtype_opt = {
        "user_id": "uint32",       # up to 4.3 billion users
        "age": "uint8",            # 0-255 is plenty
        "followers": "uint32",     # up to 4.3 billion followers
        "country": "category",     # only 5 distinct values
        "is_active": "category",   # only 2 distinct values
    }
return pd.read_csv(path, dtype=dtype_opt, parse_dates=["signup"])Dates: parse_dates turns the text "2021-04-03" into a real date, which is stored as one number.
How much did that save?
naive: 94.251291 MB
tight: 9.500785 MBWhere the memory went, column by column
// Draw only: every column's size was measured in Python (memory_chart).
{
  const rows = memory_chart.rows;
  return Plot.plot({
    width: 880, height: 300, marginLeft: 110, marginRight: 90, marginTop: 30, marginBottom: 46,
    style: {fontSize: "16px", background: "transparent", overflow: "visible"},
    x: {label: "memory (MB) →", labelAnchor: "center", grid: true},
    y: {label: null, domain: memory_chart.order},
    color: {domain: memory_chart.columns, legend: true, swatchSize: 16,
            range: ["#2a78d6", "#1baf7a", "#eda100", "#eb6834", "#e87ba4", "#4a3aa7"]},
    marks: [
      Plot.barX(rows, {y: "how", x: "mb", fill: "column", rx: 2}),
      Plot.text(memory_chart.totals, {y: "how", x: "mb", text: "label",
                 dx: 10, textAnchor: "start", fontWeight: "bold", fontSize: 20}),
      Plot.ruleX([0])
    ]
  });
}
{
// Print only: every number and label below was computed in Python (memory_chart).
const m = memory_chart;
return html`<div class="ojs-readout">${m.rows_label} users:
<b>${m.shrink}× smaller</b>. At Instagram's 3 billion users that is
<span class="match">${m.at_scale.load_naive}</span> versus
<span class="notify">${m.at_scale.load_tight}</span>.</div>`;
}Choosing the right data types affects memory, sometimes a lot.
Today’s takeaways
- \(\log n\) is how many times you can halve \(n\) before reaching 1. Doubling \(n\) adds one step.
- Hash tables (
set,dict) work out the bucket from the item itself, so insert, delete and search are \(O(1)\) on average. - Space complexity predicts how much memory your code needs as the input grows.
- Measure memory with
psutil(machine),nbytes(array),getsizeof(object),memory_usage(deep=True)(dataframe). - Data types matter: smaller dtypes and
categorycan shrink a dataframe many times over, as long as every value fits.
Read on your own
We did not get to these in class. They are part of this lecture.
dict and missing keys
Count how many users signed up from each country:
A plain dict makes you handle a missing key yourself, for example with get:
defaultdict creates missing keys for you
defaultdict(f) calls f() to make the value for a key it has not seen yet.
defaultdict(int) for counting, defaultdict(list) for grouping, defaultdict(set) for unique items.
Questions?