www.skysheng.io/dsci_100_sky_slides/slides/slides_03.html#/title-slide

Check out Julia’s how to debug guide on Piazza. Most errors are quick to fix once you know what to look for.
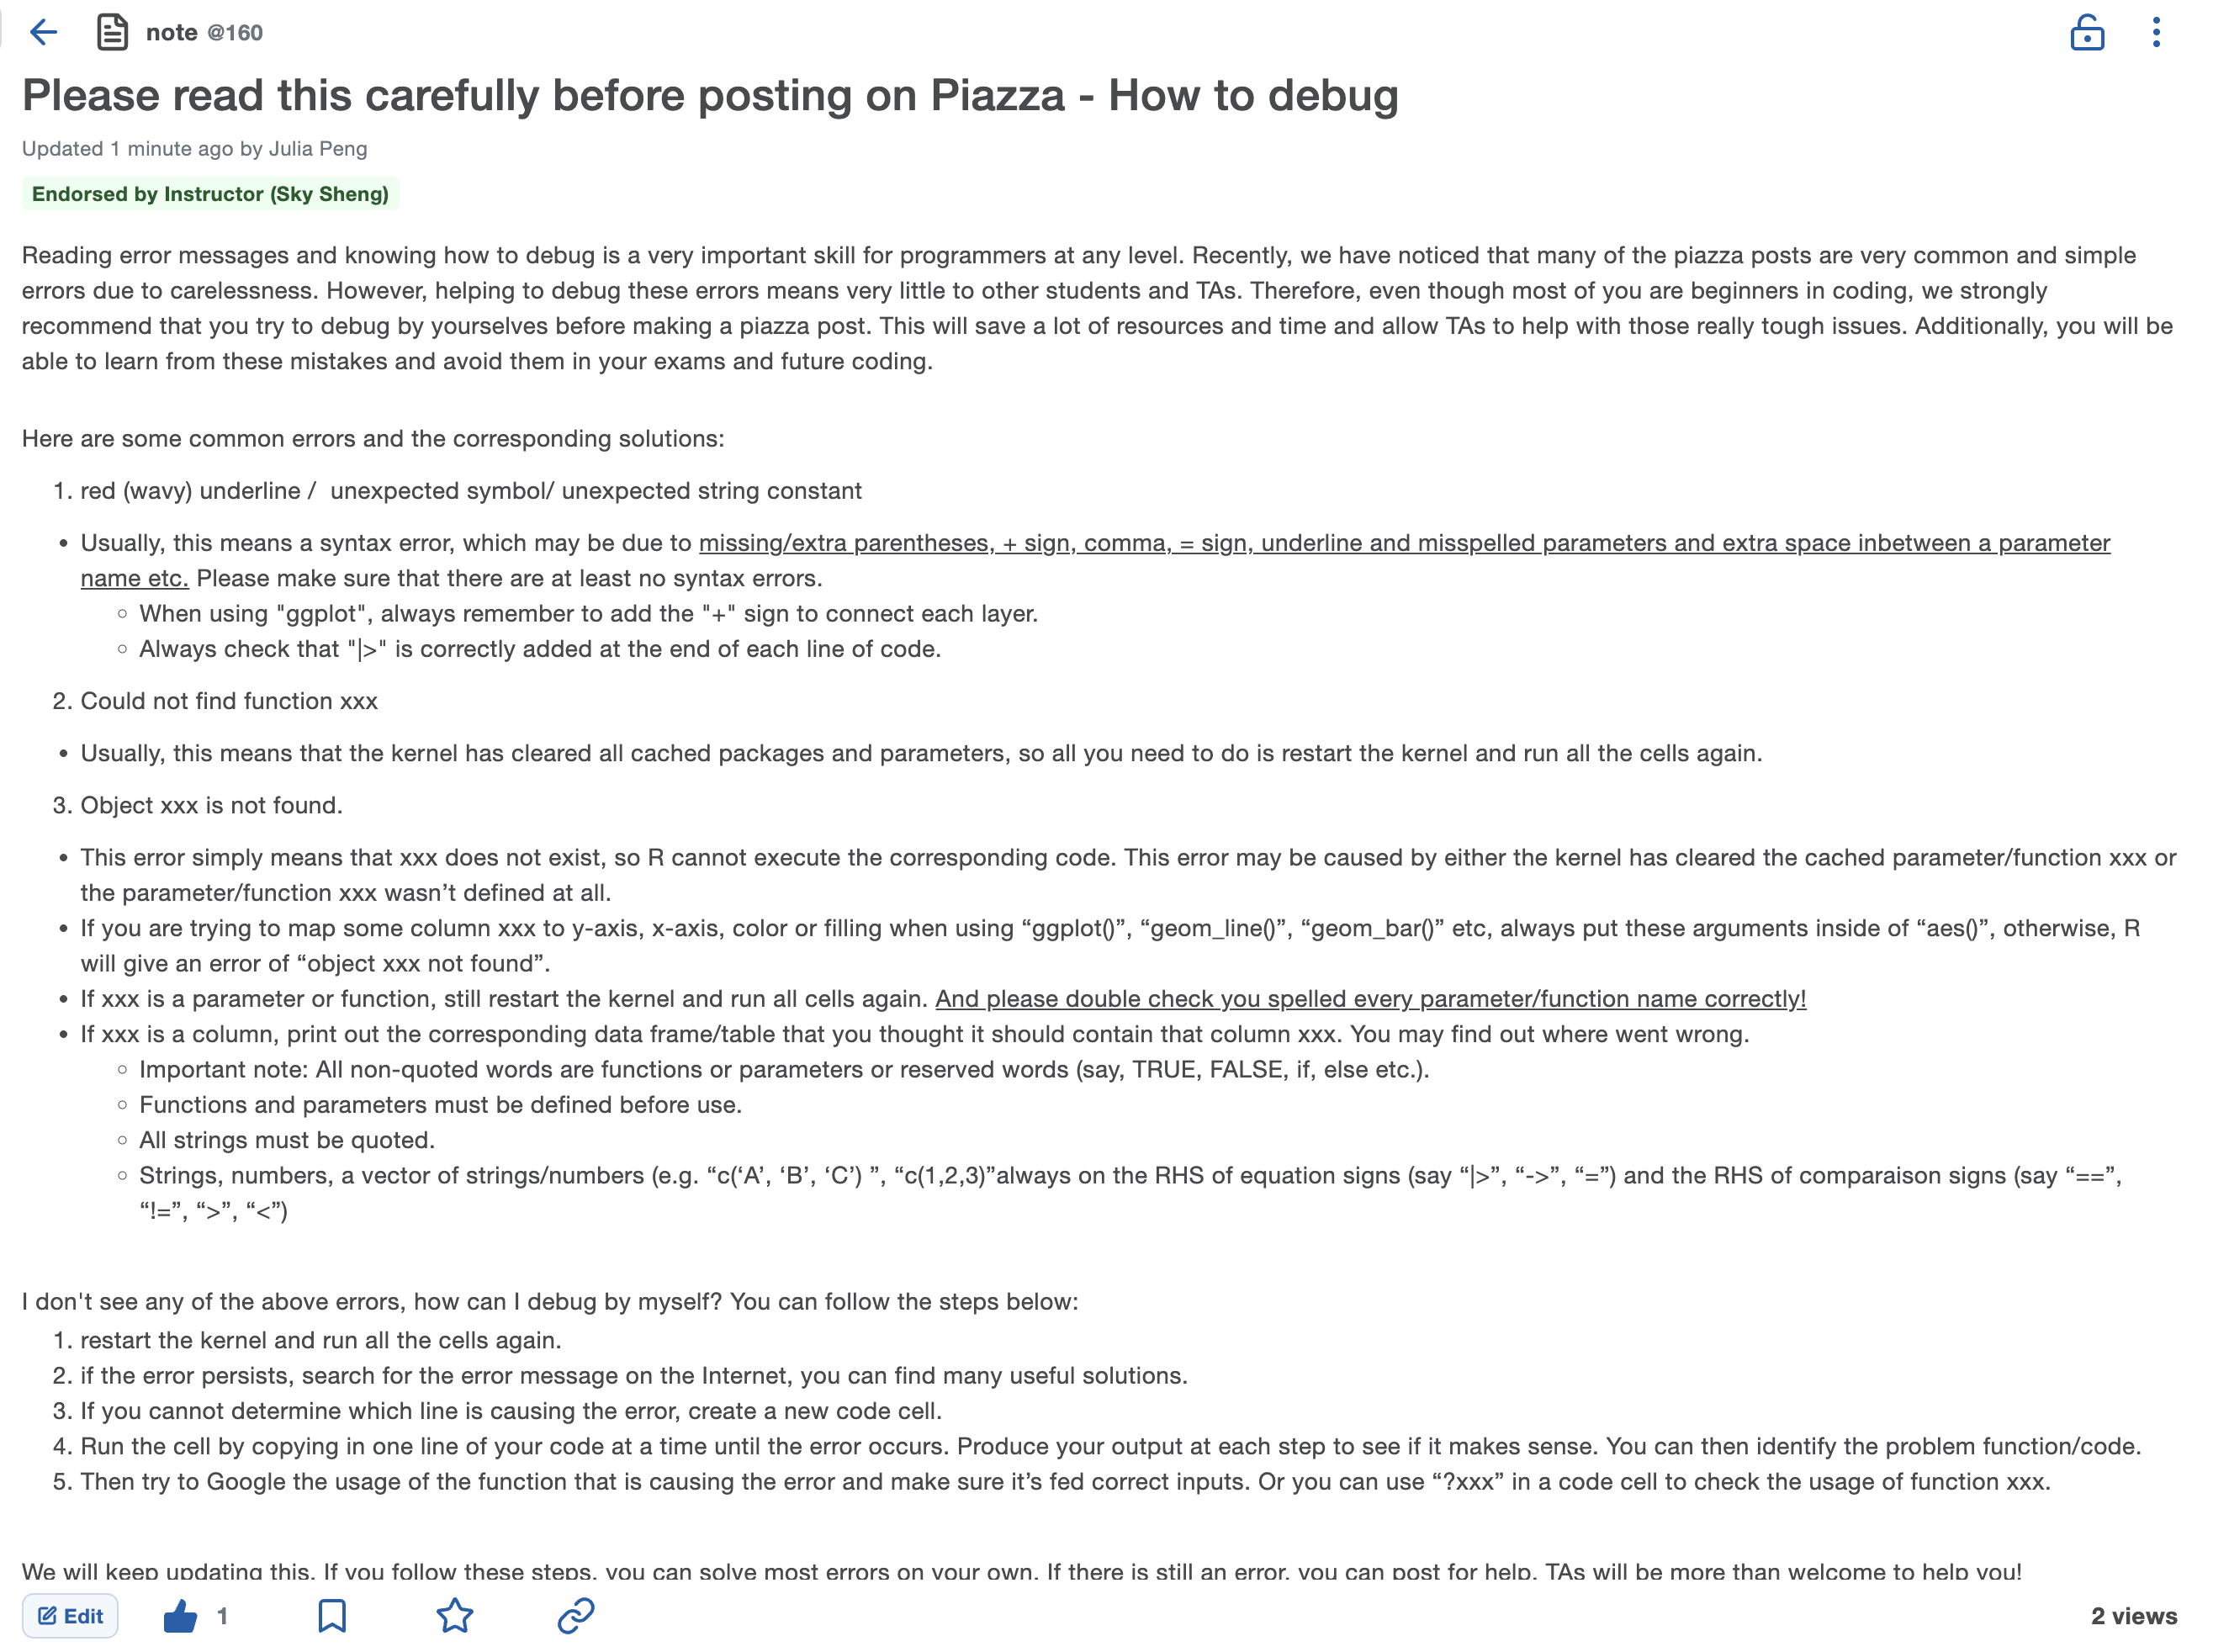
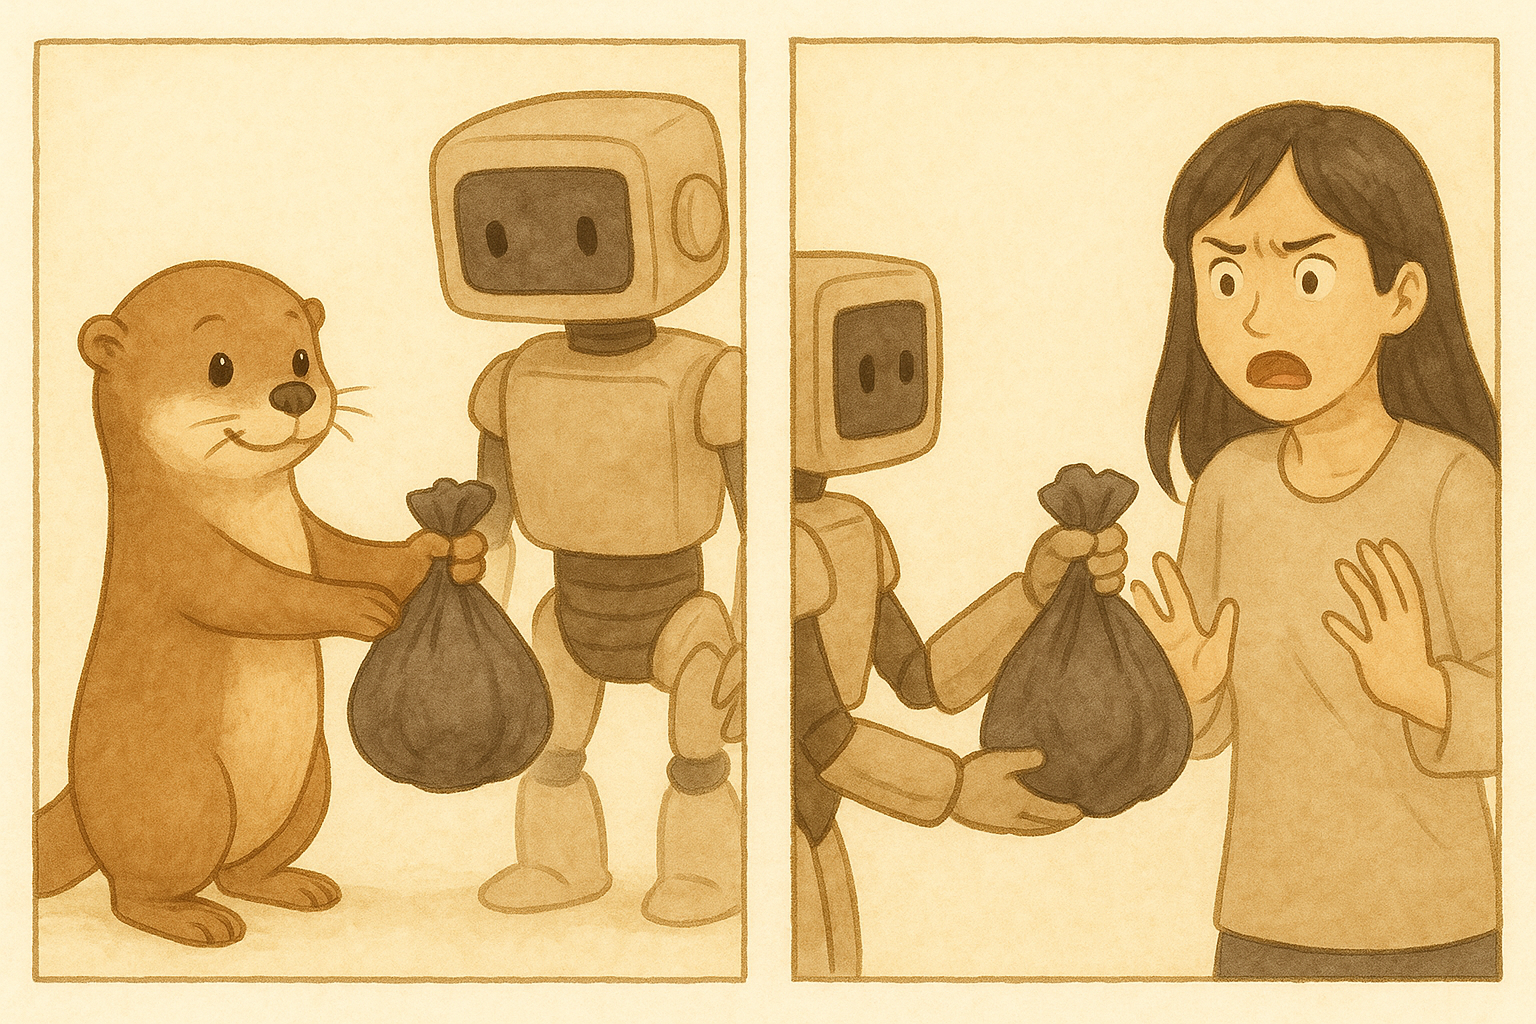
Image generated by OpenAI GPT-2.5-sunburst model
\ tells R: the next character is special, don’t read it normally.\t a tab\n a new line\\ a real backslashprint() will “ignore” escape characters like \n and print out escape characters as stringscat() will honor the rules of escape characters and turn \t into a tab, \n into a new line, etc.. and .. in relative pathshome/
└── skysheng/
├── images/
└── story_of_otter/ ⬅️ cwd
├── clown_dungeon/
│ └── ollie.txt
├── home_of_ollie/
└── ocean/
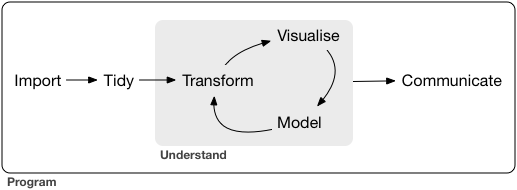
. means here, the folder I am in.. means one folder up../images go up to skysheng/, then into images/../.. go up twice, to home/ls list files and folders in the current folderpwd print the current working directory (where am I?)cd change directory (go to a different folder)cat print the contents of a file (print the text of a file)Week 2 was import. Today is tidy and transform.
Source: Grolemund & Wickham, R for Data Science
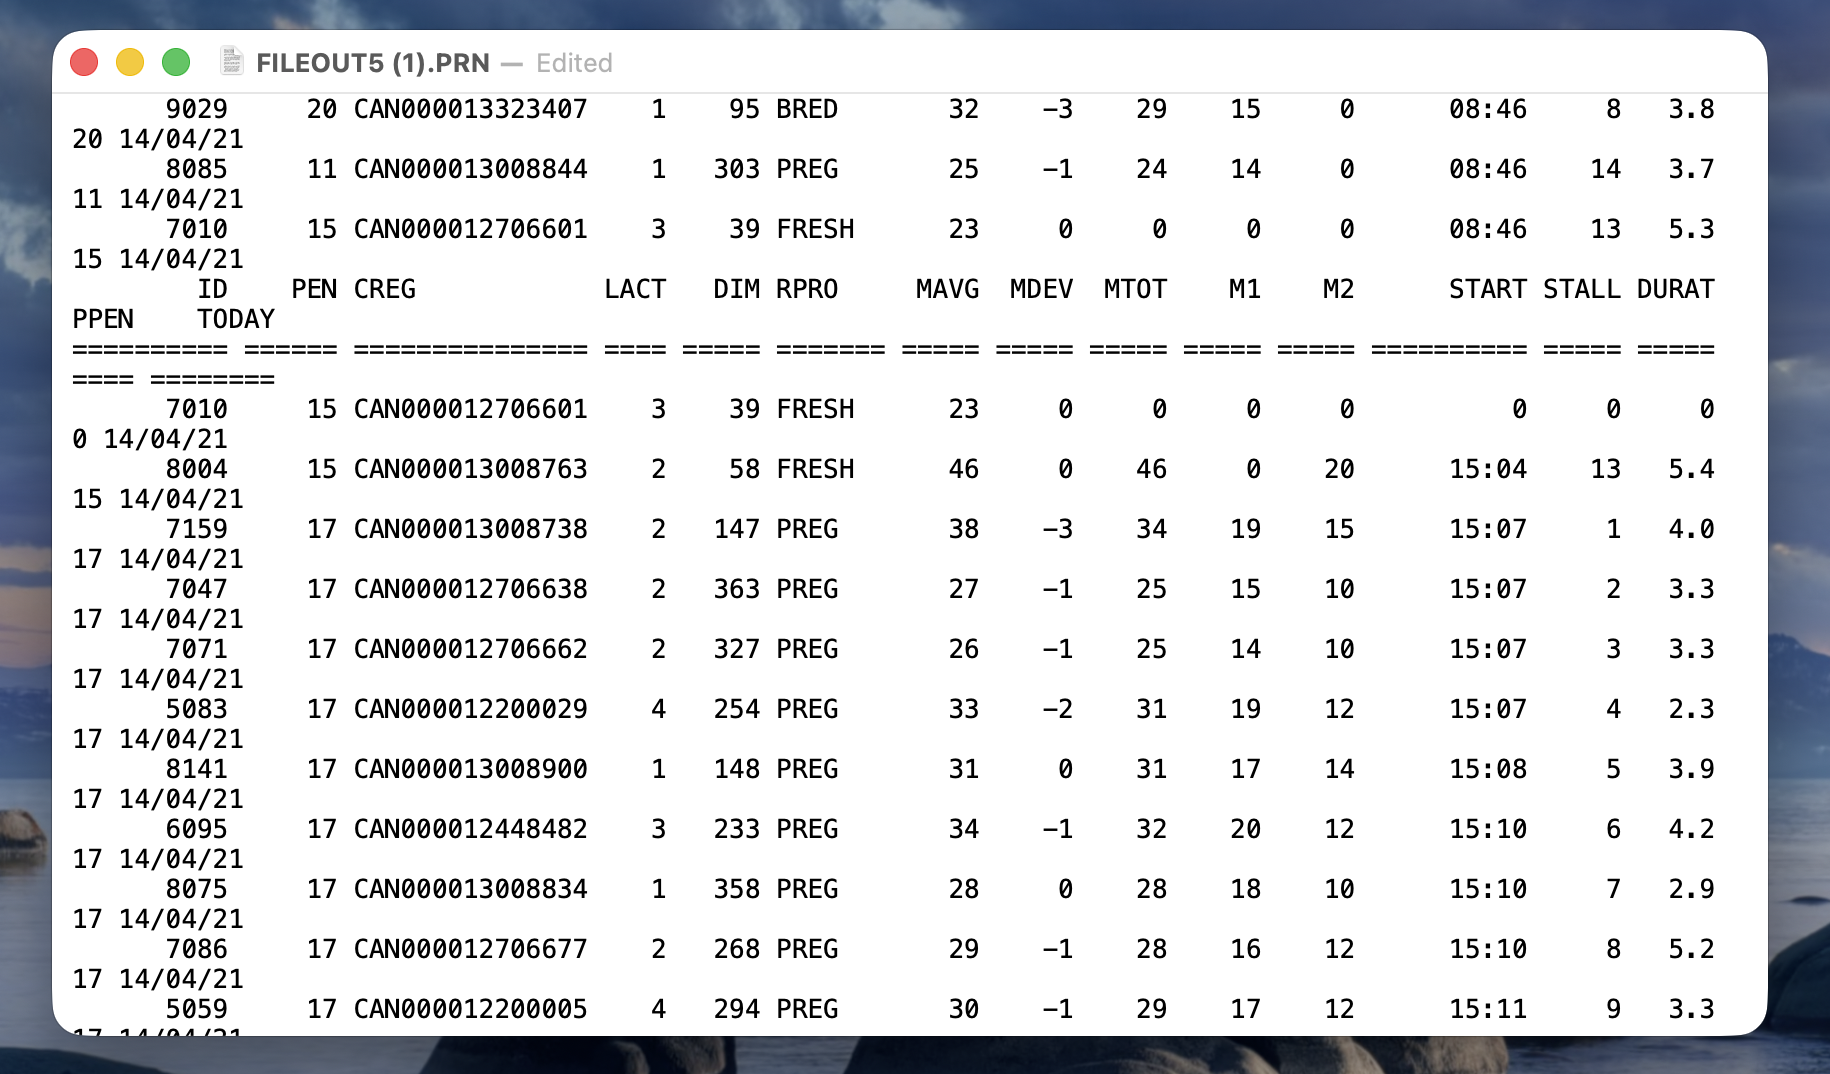
Two screenshots from the same file. What problems do you spot?
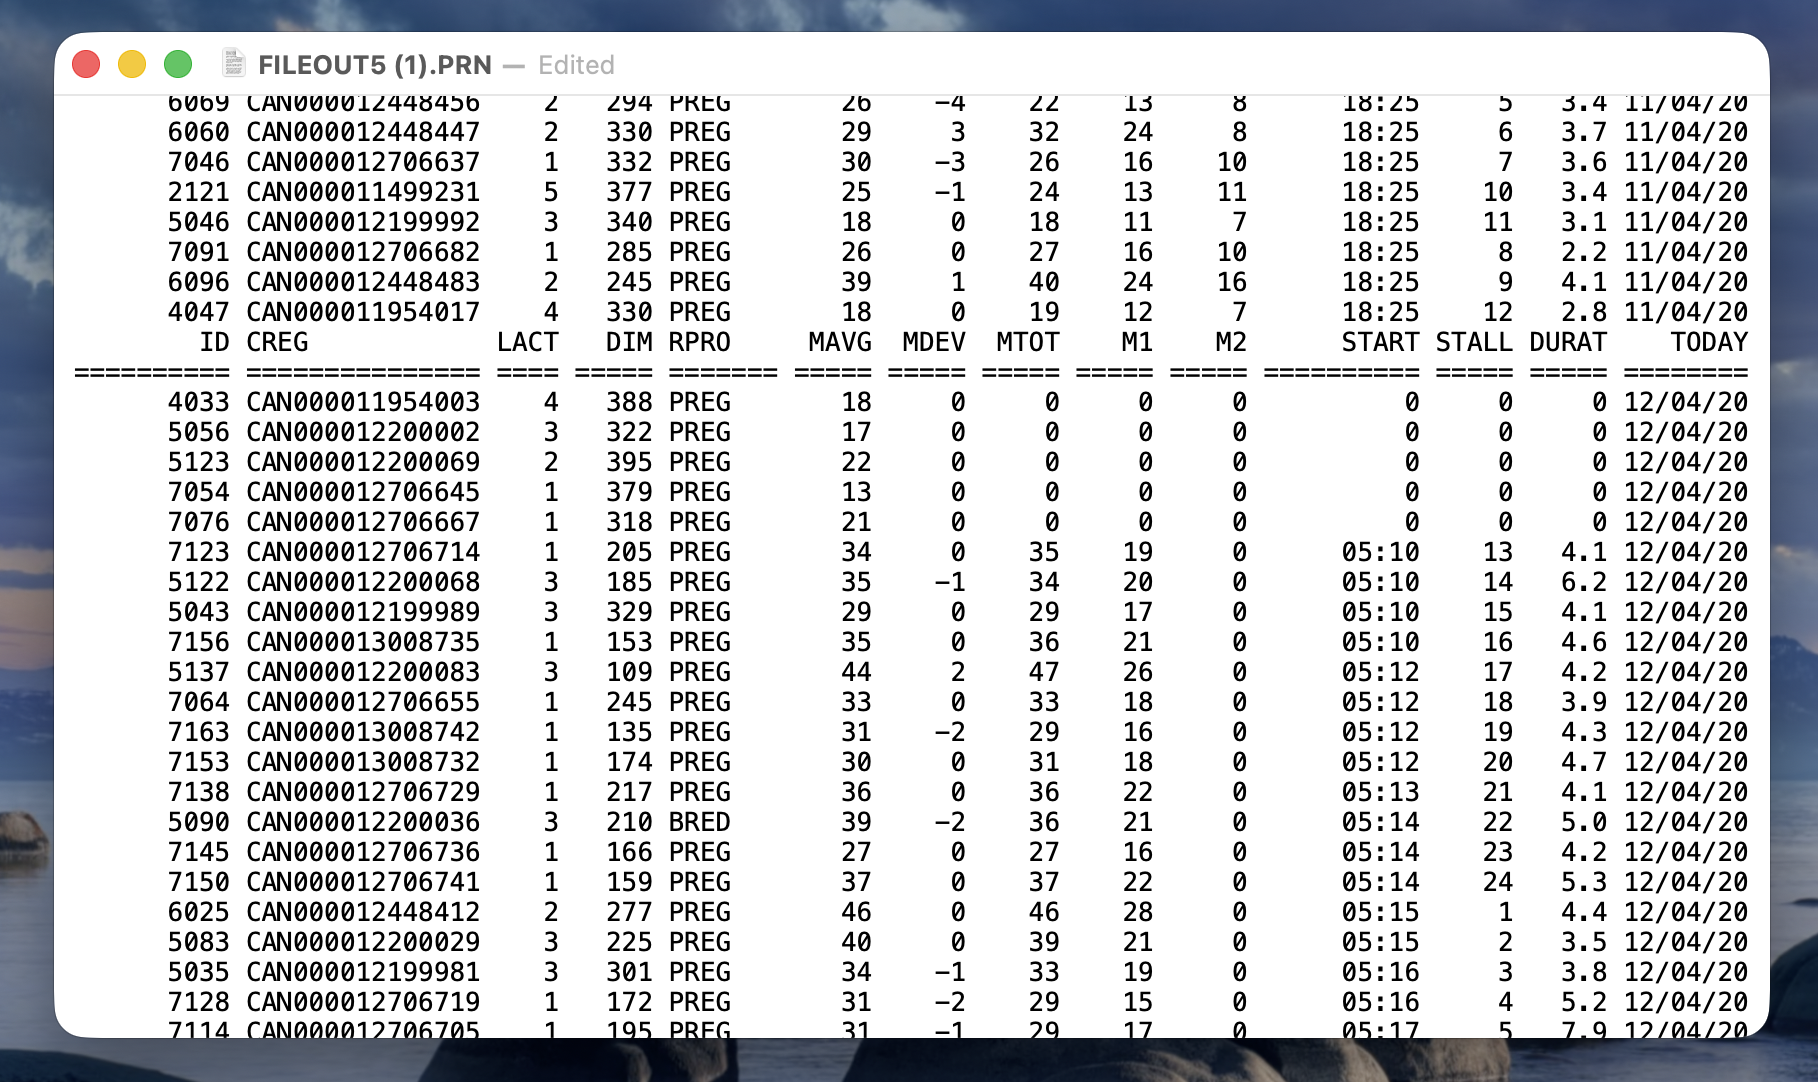

===== line repeat in the middle of the file, every time a new day starts.🔥 Roast my repo: Sky’s first R script for data cleaning
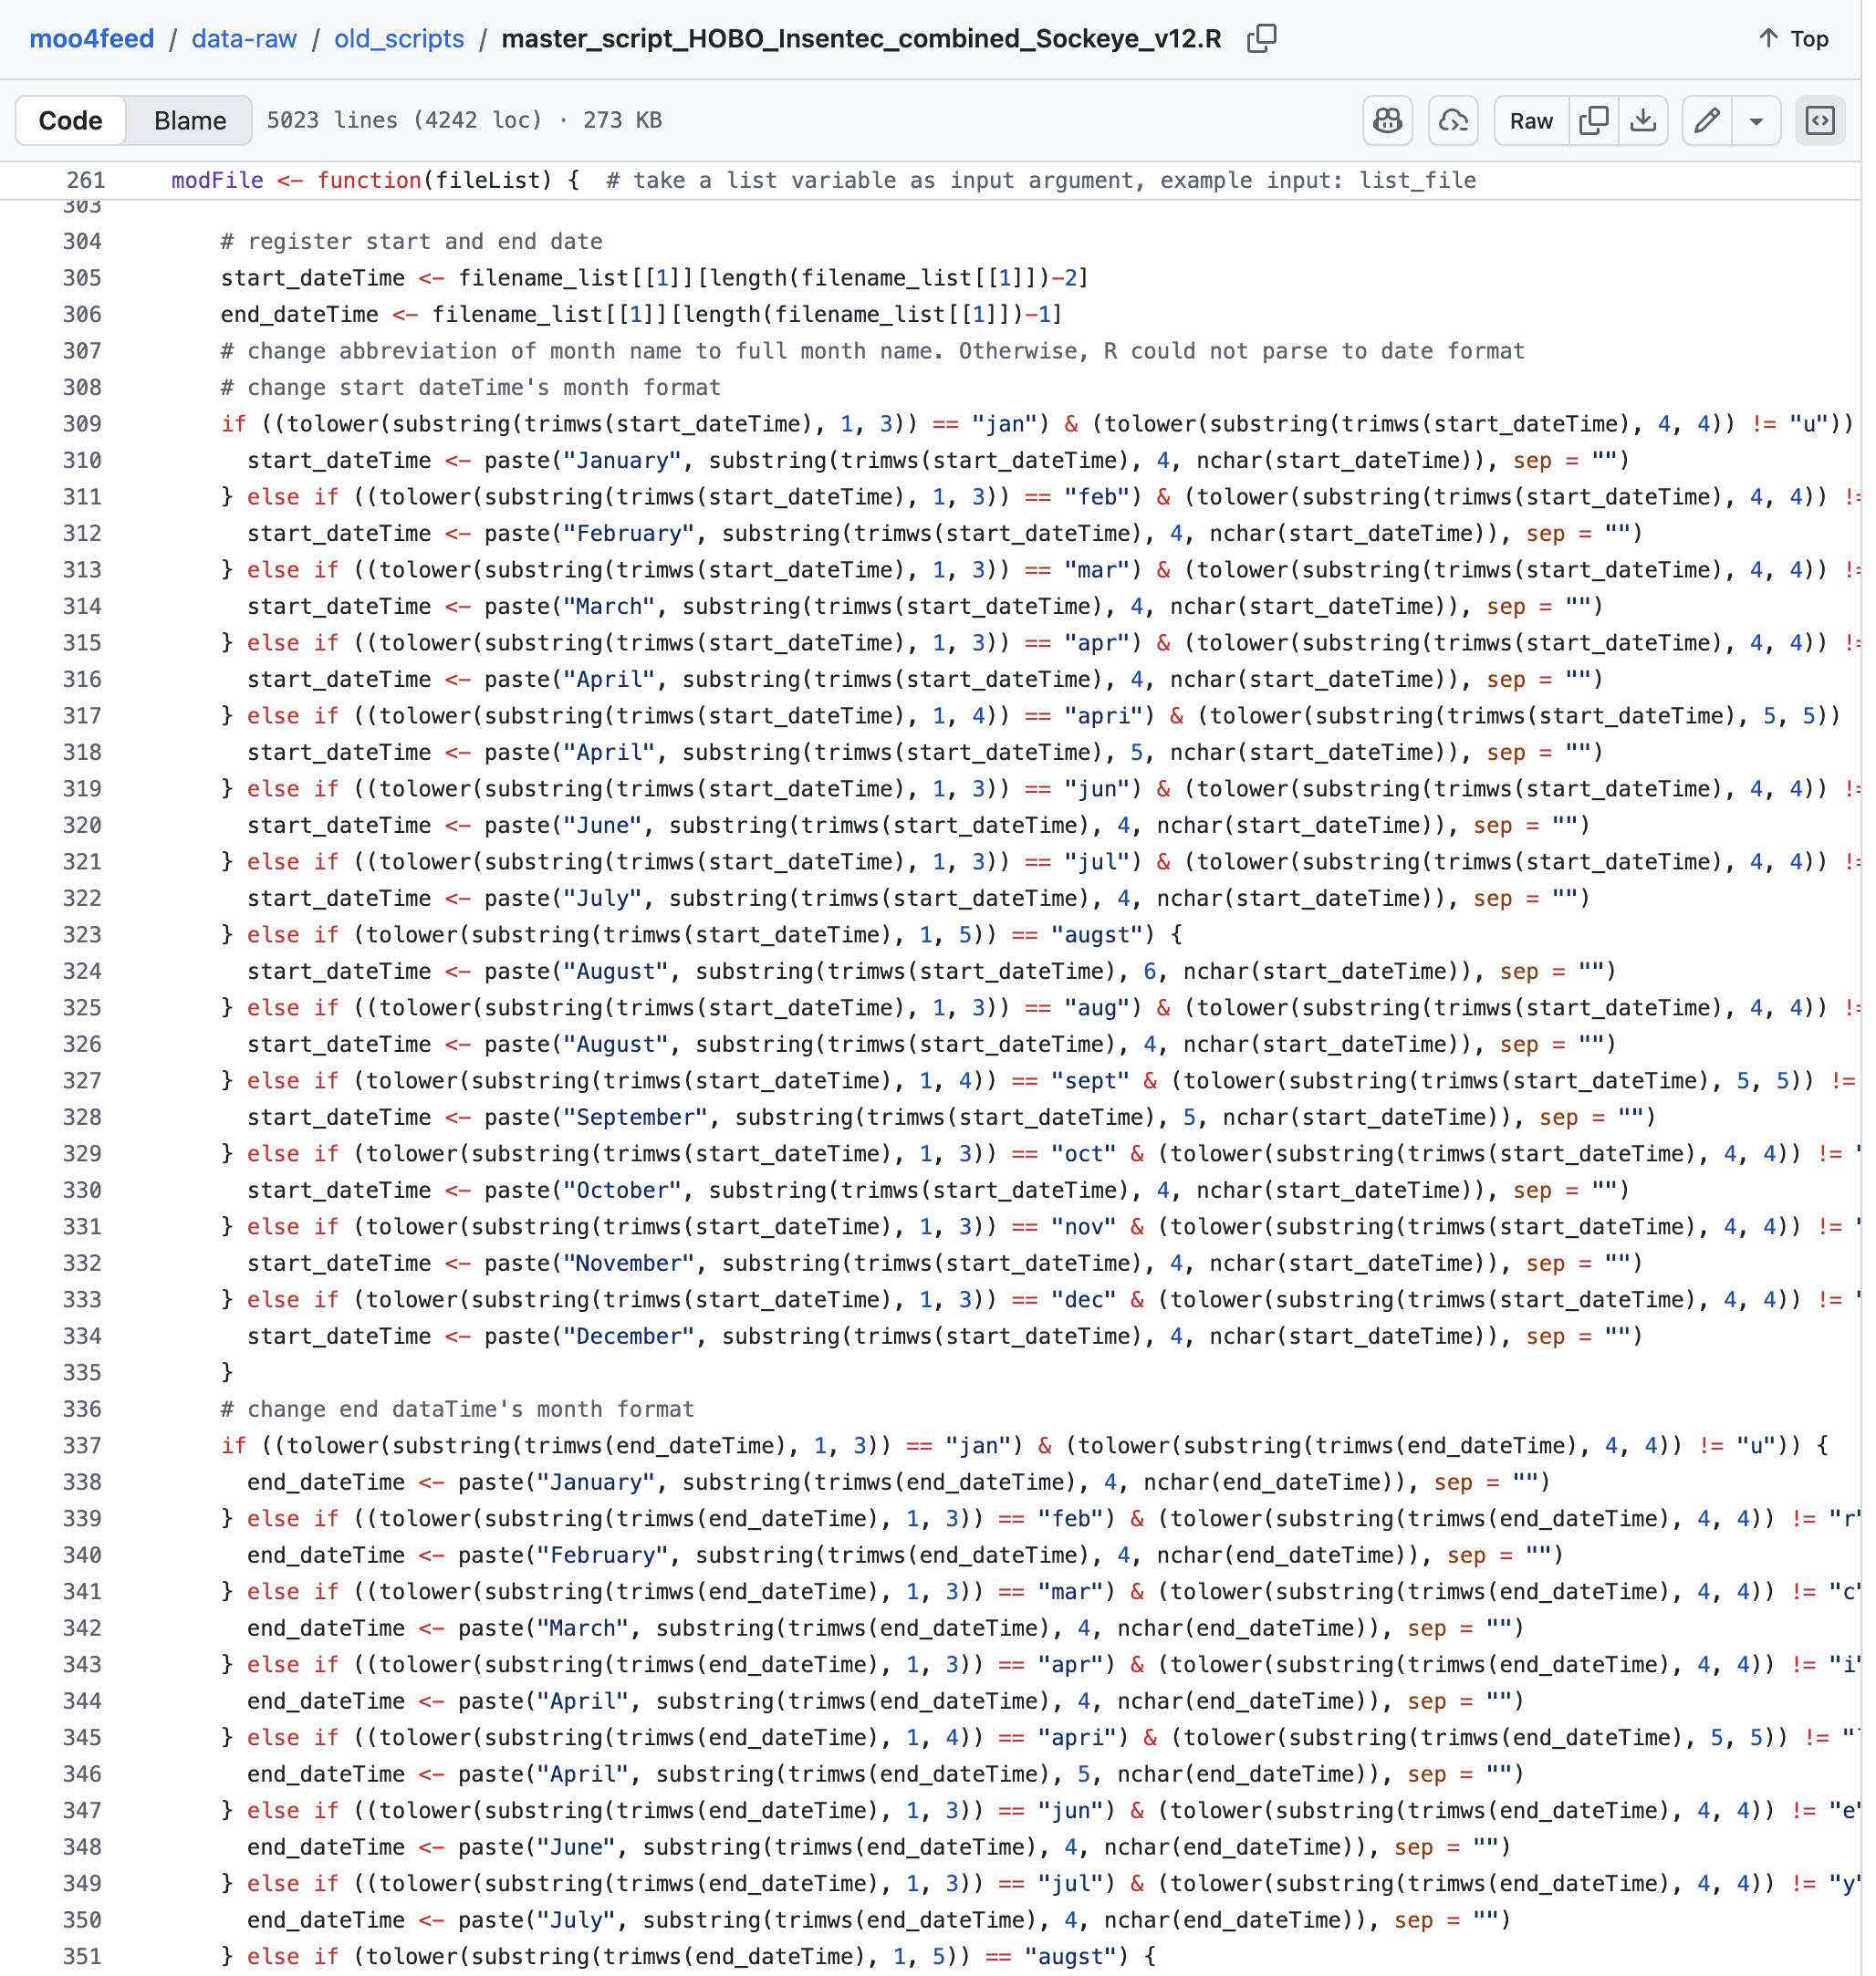
Rewritten with tidyverse as an R package: moo4feed
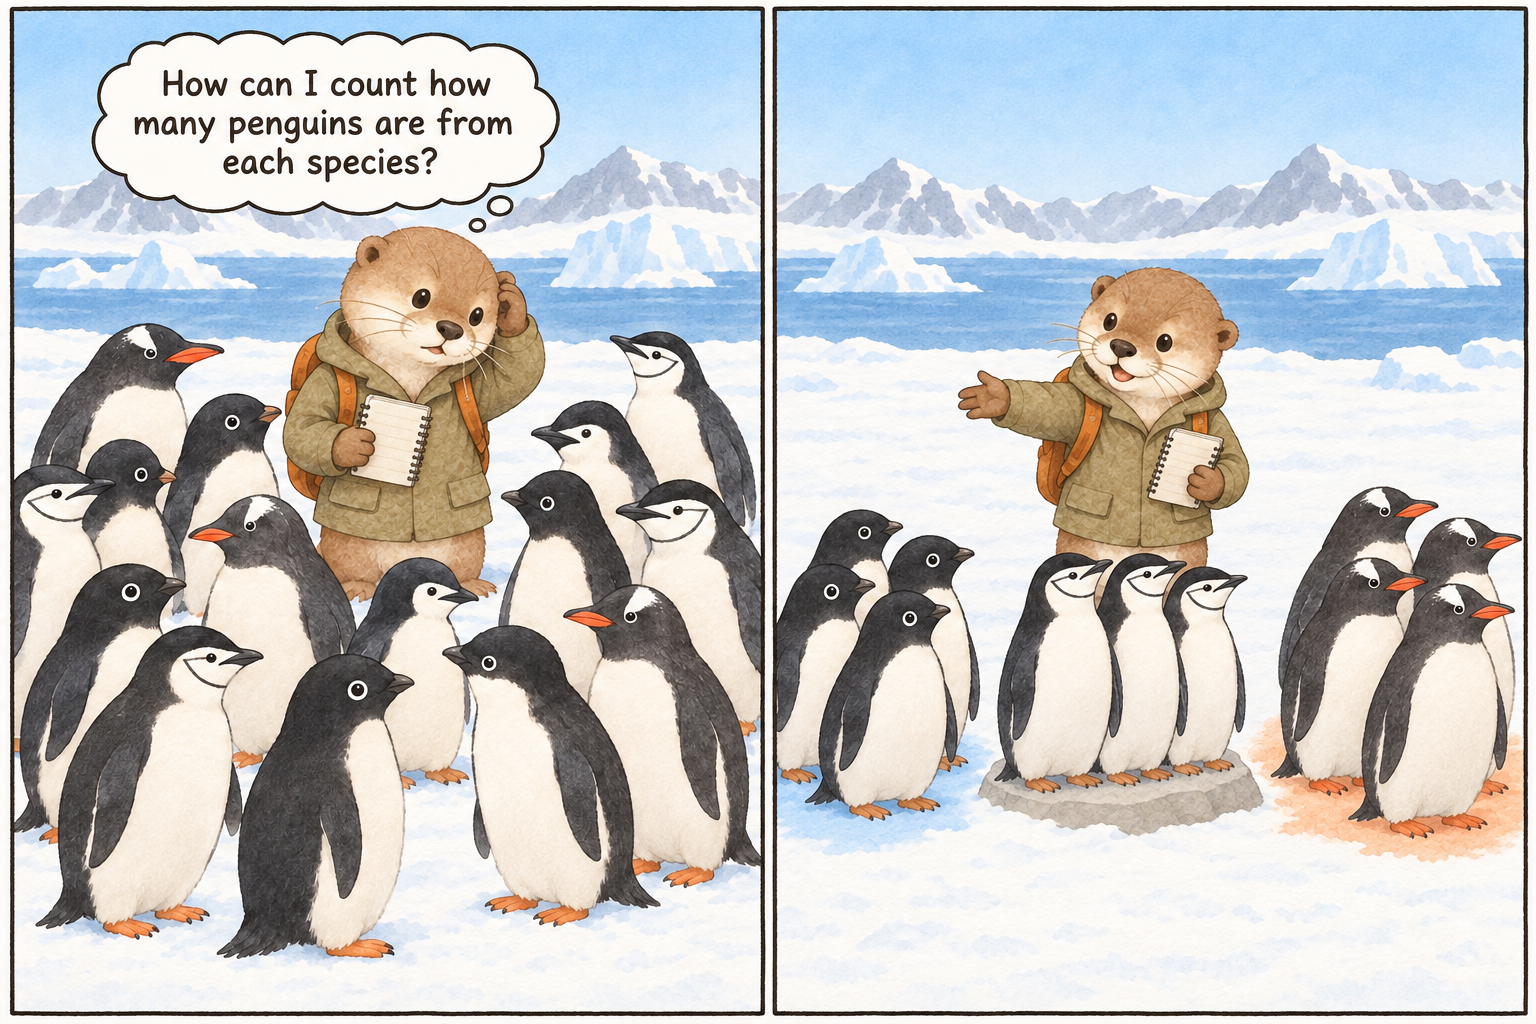
Image generated by OpenAI GPT-2.5-sunburst model
Dr. Kristen Gorman and the Palmer Station team measured 344 penguins of three species on three islands in Antarctica.
Penguin artwork by Allison Horst. Data: Gorman, Williams & Fraser (2014), Palmer Station LTER.
Somebody hands you “the data”.
NA, -999, n/a, or nothing at all
Reading it in successfully does not mean it is ready to analyze.
Image generated by OpenAI GPT-2.5-sunburst model

| student | major | year |
|---|---|---|
| Ama | CPSC | 2 |
| Bo | STAT | 1 |
| Cai | BIOL | 3 |
One row per student. One column per thing about them. One value per box.
Goal: compare tuberculosis rates, taking population into account.
| country | year | rate |
|---|---|---|
| Afghanistan | 1999 | 745/19987071 |
| Afghanistan | 2000 | 2666/20595360 |
| Brazil | 1999 | 37737/172006362 |
| Brazil | 2000 | 80488/174504898 |
| China | 1999 | 212258/1272915272 |
| China | 2000 | 213766/1280428583 |
Answer: B, false. The rate box holds two values, cases and population, glued together with a slash. R sees text, not two numbers. You cannot take a mean of it, plot it, or filter on it.
Follow up: what would you do about it? Split it into a cases column and a population column.
| country | cases (1999) | cases (2000) | population (1999) | population (2000) |
|---|---|---|---|---|
| Afghanistan | 745 | 2666 | 19987071 | 20595360 |
| Brazil | 37737 | 80488 | 172006362 | 174504898 |
| China | 212258 | 213766 | 1272915272 | 1280428583 |
year is a variable, and it has been smeared across four column names instead of living in a column of its own.This shape has a name: wide. pivot_longer() is what turns it back into tidy. That is the worksheet’s job this week.
| country | 1999 | 2000 |
|---|---|---|
| Afghanistan | 745 | 2666 |
| Brazil | 37737 | 80488 |
| China | 212258 | 213766 |
Answer: B, false. Same problem as the last one. year is a variable, and it is smeared across the column names 1999 and 2000 instead of living in a column of its own.
Column name also needs to be informative!
| country | year | key | value |
|---|---|---|---|
| Afghanistan | 1999 | cases | 745 |
| Afghanistan | 1999 | population | 19987071 |
| Afghanistan | 2000 | cases | 2666 |
| Afghanistan | 2000 | population | 20595360 |
| Brazil | 1999 | cases | 37737 |
| Brazil | 1999 | population | 172006362 |
| Brazil | 2000 | cases | 80488 |
| Brazil | 2000 | population | 174504898 |
| China | 1999 | cases | 212258 |
| China | 1999 | population | 1272915272 |
| China | 2000 | cases | 213766 |
| China | 2000 | population | 1280428583 |
Answer: B, false. Each observation, one country in one year, is split across two rows here: one for cases and one for population. A tidy table needs one row per observation, so cases and population should each get their own column.
| country | year | cases | population |
|---|---|---|---|
| Afghanistan | 1999 | 745 | 19987071 |
| Afghanistan | 2000 | 2666 | 20595360 |
| Brazil | 1999 | 37737 | 172006362 |
| Brazil | 2000 | 80488 | 174504898 |
| China | 1999 | 212258 | 1272915272 |
| China | 2000 | 213766 | 1280428583 |
All of this lives inside tidyverse, the one package you already load every time:
dplyr reshapes the rows and columns: select, filter, mutate, group_by, summarizetidyr changes the shape itself: pivot_longer, pivot_widerpurrr repeats a job across many columns: map_dfrImage generated by OpenAI GPT-2.5-sunburst model
select() keeps a subset of the columns (variables) and drops the rest.
Helpers that select by name pattern: starts_with(), ends_with(), contains(), matches(), num_range().
Note the quotation marks here. "bill_" is a piece of text to match, not a column name, so it does need quotes.
Image generated by OpenAI GPT-2.5-sunburst model
filter() keeps a subset of the rows (observations) and drops the rest.
Goal: keep only penguins with flippers longer than 190 mm.
== and =?Goal: Chinstrap penguins and flippers longer than 190 mm.
A & BA | B!AA == BA != BA > BA < BA >= BA <= BImage generated by OpenAI GPT-2.5-sunburst model
mutate() builds a new column out of the columns you already have.
Goal: body mass in pounds instead of grams, saved as penguins_lbs. 454 g is 1 lb.
You often need several data cleaning steps in a row. Three ways to write it:
|>penguins_1 and penguins_2 get used|>The pipe takes whatever is on its left and hands it to the first argument of the function on its right.
%>% is also a pipe operator, but was used in the previous versions of R.veggies → cut it up → keep the big pieces → fry everything in a pan
Each station does one job and slides the bowl to the next.
Using the avocado sales data, write a pipeline that:
total_volume (the sum of small_hass_volume, large_hass_volume and extra_l_hass_volume)Date, average_price and total_volume columnsImage generated by OpenAI GPT-2.5-sunburst model
Grouping splits the rows into piles based on the value in a column.
Summarizing combines data from each pile into a few summary values.
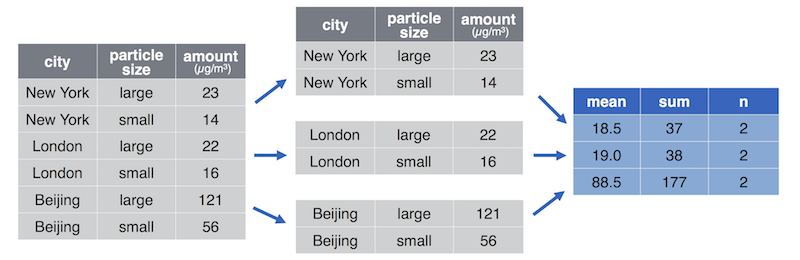
Image source: INFO 201, University of Washington
{
// Draw only: every dot position and every average was computed in R.
const dots = transpose(penguin_dots);
const means = transpose(penguin_means);
const order = means.map(d => d.species);
const palette = ["#2a78d6", "#eb6834", "#1baf7a"];
return Plot.plot({
width: 880, height: 330, marginLeft: 120, marginRight: 40, marginBottom: 46,
style: {fontSize: "16px", background: "transparent"},
x: {label: "body mass (g) →", labelAnchor: "center", grid: true},
y: {axis: null, domain: [-0.5, 0.5]},
fy: {label: null, domain: order},
color: {domain: order, range: palette, legend: false},
marks: [
Plot.dot(dots, {fy: "species", x: "body_mass_g", y: "jitter", fill: "species",
r: 3.5, fillOpacity: show_means ? 0.16 : 0.55}),
show_means
? Plot.ruleX(means, {fy: "species", x: "avg_body_mass",
stroke: "species", strokeWidth: 3})
: null,
show_means
? Plot.text(means, {fy: "species", x: "avg_body_mass", y: 0,
text: d => `${d.avg_body_mass} g`,
dy: -44, fontWeight: "bold", fill: "species"})
: null
]
});
}You want the average of four columns. You could write this:
map_dfr() is a function that iterates over columns. For example, below we are calculating the mean of each column in the penguins data frame.
bill_length_mm:body_mass_g means “these two columns and everything between them”map_dfr() applies one function to every column and returns a data frame of the resultsmap_… functions that you could use (map, map_lgl, map_chr, etc). Usually in this course we’ll only use map_dfr, but you should investigate the others yourself!worksheet_wrangling due SATURDAY, Sep 26, 11:59pmtutorial_wrangling due SATURDAY, Sep 26, 11:59pmThere are NO late submissions for worksheets. We drop the lowest worksheet and the lowest tutorial score. See the policy for late registrants.
If not, let’s work on this week’s worksheet together.